🌊 Tide

Information moves like the tide. We pick the waves worth studying.

中文

← Today's tide

Published 2026-07-16 · Tsinghua University, Zhejiang University, The Chinese University of Hong Kong · Jinyang Wu, Shuo Yang, Zhengxi Lu et al.

SEED: Self-Evolving On-Policy Distillation for Agentic Reinforcement Learning

arXiv · HuggingFace · ▲90

Abstract (verbatim)

Large language models are increasingly trained as interactive agents for long-horizon tasks involving multi-turn interaction, tool use, and environment feedback. Outcome-based reinforcement learning (RL) provides a practical optimization paradigm, but its sparse trajectory-level rewards offer limited guidance on intermediate decisions, leaving a supervision gap between episode-level outcomes and token-level policy learning. We propose SEED (SElf-Evolving On-Policy Distillation), a self-evolving framework that converts completed on-policy trajectories into training-time hindsight skills and distills their behavioral effect back into the policy model. SEED first fine-tunes the policy to analyze completed trajectories and generate natural-language skills that capture reusable workflows, decisive observations, or failure-avoidance rules. During RL, the current policy both collects trajectories and serves as the analyzer that extracts hindsight skills from them. Policy updates therefore improve subsequent decision making and skill analysis together, allowing hindsight supervision to evolve with the policy. SEED then re-scores the sampled actions under ordinary and skill-augmented contexts, converting the skill-induced probability shift into a dense token-level on-policy distillation signal. This signal is jointly optimized with outcome-based RL, keeping the auxiliary supervision aligned with the current trajectory distribution. Extensive experiments on text-based and vision-based agentic tasks show that SEED consistently improves performance and sample efficiency, exhibiting robust generalization to unseen scenarios. Our code is available at https://github.com/jinyangwu/SEED.

Background

Background Analysis

1. Technical Context and Real-world Needs
Recent large language models (LLMs) are increasingly applied to multi-turn agentic tasks, such as tool use, environmental feedback processing, and long-horizon planning. These scenarios require models to learn how to collect information, call tools, interpret feedback, and adjust strategies over multiple steps. Reinforcement learning (RL) has become a key paradigm for optimizing such agent behaviors because it directly adjusts policies based on environmental feedback. However, in real-world settings, reward signals are often sparse and delayed (e.g., given only at task completion), making it difficult for models to learn effective behaviors from intermediate steps, thus limiting their decision-making capability and sample efficiency.

2. Limitations of Previous Methods
Traditional RL methods rely on trajectory-level rewards but fail to guide intermediate decisions (e.g., a failed trajectory may contain partially correct behaviors, while a successful trajectory may hide reusable strategies). Although some studies have attempted to extract experience from trajectories using "hindsight learning" (e.g., summarizing success patterns or failure reasons), these methods typically treat hindsight as static data or external memory, unable to adapt dynamically as the model's capabilities improve. Additionally, existing approaches either depend on a fixed teacher model for supervision or require extra reasoning traces or prompts, leading to a disconnect between the supervision signal and the model's current behavior.

3. Solution Proposed in This Paper
The SEED framework addresses this issue through "self-evolving on-policy distillation." Its core idea is to let the model play two roles simultaneously during reinforcement learning:
- Analyzer Role: The model extracts natural-language describable reusable skills (e.g., key observations, decision rules, or error-avoidance strategies) from completed trajectories.
- Decision-maker Role: The model improves subsequent decisions based on these skills and converts the behavioral guidance from skills into fine-grained token-level supervision signals through distillation.
Through this self-evolving loop, the model can dynamically optimize both its behavioral analysis and decision-making capabilities without relying on external memory or static data.

4. Key Differences from Previous Work
The uniqueness of SEED lies in:
- Dynamic Supervision: The hindsight signal is not fixed but evolves with the model's policy improvements.
- Dense Supervision: It converts trajectory-level hindsight into token-level distillation signals, directly guiding intermediate decisions.
- Self-consistency: The model performs both decision-making and reflection during reinforcement learning, avoiding the disconnect between the teacher model and the environment in traditional methods.
This approach enables SEED to achieve higher sample efficiency and robustness in long-horizon agentic tasks.
Method, Figure by Figure

M E T H O D1 / 17

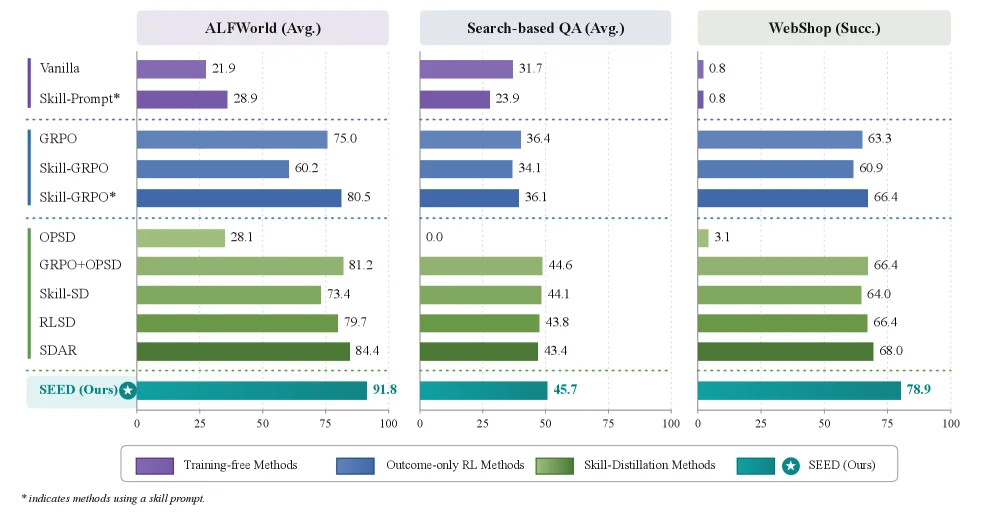
Figure 1: Overall performance overview. Compared with powerful baseline methods, Seed achieves the strongest average performance across three representative agentic benchmarks.

This figure is a result graph from the paper "SEED: Self - Evolving On - Policy Distillation for Agentic Reinforcement Learning", which is used to show the performance of different methods on three representative agent benchmarks (ALFWorld, Search - based QA, WebShop) to demonstrate the superiority of the proposed SEED method.

Components and Information Flow of the Figure

  • Horizontal Axis: Represents the value of the performance metric, ranging from 0 to 100. The meaning of the performance metric is different for different benchmark tests. For ALFWorld and Search - based QA, it is the average score (Avg.), and for WebShop, it is the success proportion (Succ.).
  • Vertical Axis: Lists different methods, which are divided into four categories and distinguished by different colors and labels:
    • Training - free Methods: Represented by purple, including Vanilla, Skill - Prompt*. This type of method does not require additional training processes and directly operates based on existing models or simple skill prompts.
    • Outcome - only RL Methods: Represented by blue, including GRPO, Skill - GRPO, Skill - GRPO*. This type of method mainly optimizes the policy based on trajectory - level outcome rewards, but this sparse reward provides limited guidance for intermediate decisions.
    • Skill - Distillation Methods: Represented by green, including OPSD, GRPO + OPSD, Skill - SD, RLSD, SDAR. This type of method attempts to make up for the lack of supervision in intermediate decisions by distilling skills, transforming completed task trajectories into reusable skills and applying them to the policy.
    • SEED (Ours): Represented by cyan (with a star), which is our proposed method. It combines self - evolving policy distillation, transforming completed on - policy trajectories into hindsight skills at training time and distilling the behavioral effects of these skills back into the policy model.
  • Grouping and Comparison of Methods: Each category of methods has a corresponding performance bar on the three benchmark tests. By comparing the length of the performance bars of different categories of methods on the same benchmark test, the performance differences of different methods can be seen. For example, in the ALFWorld benchmark test, the performance bar of SEED (91.8) is longer than that of other methods, indicating that it has the best average performance on ALFWorld; in the Search - based QA benchmark test, the performance of SEED (45.7) is also better than that of other methods; in the WebShop benchmark test, the success proportion of SEED (78.9) is also the highest.

How the Method Works (Inferred from the Results in the Figure)

  • Core Idea of SEED: SEED is a self - evolving framework that transforms completed on - policy trajectories into hindsight skills at training time and distills the behavioral effects of these skills back into the policy model. From the results in the figure, it can be seen that the performance of SEED is better than that of other methods on the three benchmark tests, which shows that its method is effective.
  • Comparison with Other Methods:
    • The performance of training - free methods (such as Vanilla, Skill - Prompt*) is relatively low, indicating that it is difficult to achieve good performance in complex tasks only by relying on training - free methods.
    • The performance of outcome - only RL methods (such as GRPO, Skill - GRPO) is also not as good as that of SEED, which verifies the problem mentioned in the paper that "sparse trajectory - level rewards provide limited guidance for intermediate decisions". SEED makes up for this deficiency through skill distillation.
    • Although the performance of skill - distillation methods (such as OPSD, GRPO + OPSD, etc.) is better than that of training - free methods and outcome - only RL methods, it is still not as good as that of SEED. This shows that the self - evolving policy distillation method of SEED is more effective, and it can better apply hindsight skills to the policy, thus improving the performance.

Conclusion

From the figure, it can be clearly seen that compared with other powerful baseline methods, SEED achieves the strongest average performance on three representative agent benchmark tests (ALFWorld, Search - based QA, WebShop). This shows that the method of SEED (self - evolving on - policy distillation) can effectively solve the problem of insufficient supervision in intermediate decisions in reinforcement learning, thus achieving better performance in complex tasks.

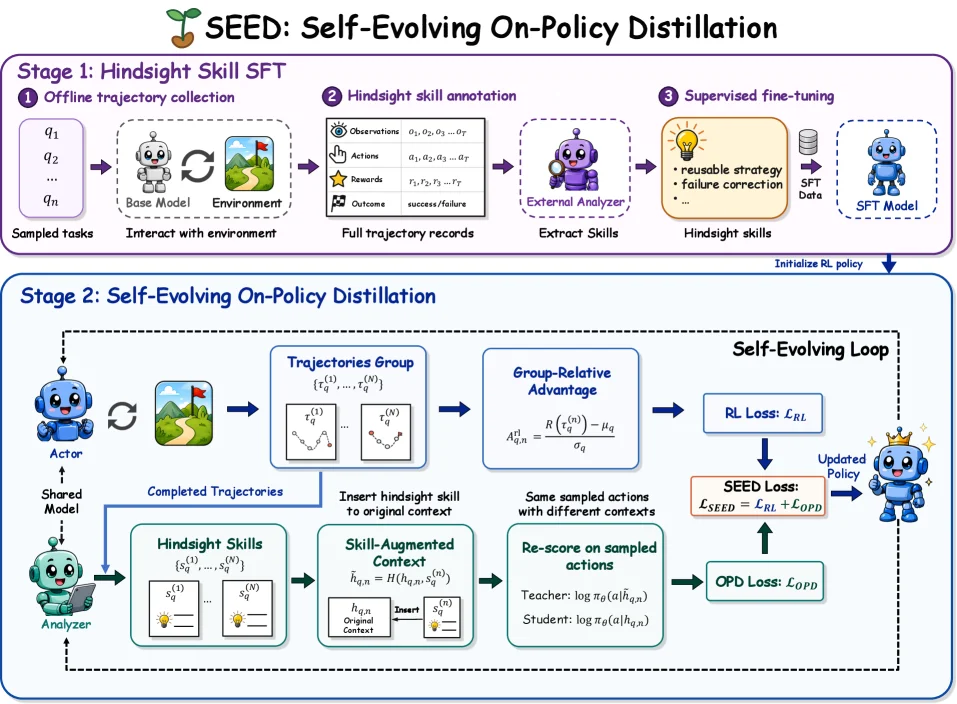
Figure 2: Overview of Seed . Stage 1 (Hindsight Skill SFT) equips the policy to extract hindsight skills from completed trajectories. Stage 2 (Self-Evolving On-Policy Distillation) jointly optimizes outcome-based RL and skill-conditioned OPD in a self-evolving agentic loop.

This diagram illustrates the two core phases of the SEED (Self-Evolving On-Policy Distillation) method, clearly presenting the overall workflow of the approach.

Phase 1: Hindsight Skill SFT (Hindsight Skill Supervised Fine-Tuning)

The goal of this phase is to enable the policy to extract hindsight skills from completed trajectories. The flow of data or information is as follows:
1. Offline Trajectory Collection
First, a base model interacts with a series of sampled tasks (e.g., \( q_1, q_2, \dots, q_n \)) in the environment to collect complete trajectory records. During this interaction, the model performs actions in the environment, and the environment provides feedback such as observations and rewards, ultimately forming a trajectory.

  1. Hindsight Skill Annotation
    Using an external analyzer, the collected complete trajectory records (including observations \( o_1, o_2, o_3, \dots, o_T \), actions \( a_1, a_2, a_3, \dots, a_T \), rewards \( r_1, r_2, r_3, \dots, r_T \), and outcomes like success or failure) are analyzed to extract skills. These skills could be repeatable strategies, failure correction methods, etc.

  2. Supervised Fine-Tuning
    The extracted hindsight skills are used as supervised data (SFT Data) to fine-tune the model, resulting in an SFT Model. This SFT Model is then used to initialize the reinforcement learning (RL) policy, preparing for the subsequent RL phase.

Phase 2: Self-Evolving On-Policy Distillation

This phase is a self-evolving loop where policy updates simultaneously improve subsequent decision-making and skill analysis capabilities, allowing hindsight supervision to evolve with the policy. The specific information flow and operations are as follows:
1. Actor and Trajectory Collection
The Actor (policy model) interacts with the environment to generate completed trajectories. These trajectories are grouped, with each group containing multiple trajectories \( { \tau_q^{(1)}, \dots, \tau_q^{(N)} } \), where \( \tau_q^{(i)} \) represents the \( i \)-th trajectory.

  1. Skill-Augmented Context
    The Analyzer (which shares the model with the Actor, i.e., Shared Model) extracts hindsight skills (e.g., \( { s_q^{(1)}, \dots, s_q^{(N)} } \)) from the completed trajectories. These skills are then inserted into the original context (\( h_{q,n} \)) to form a skill-augmented context \( \hat{h}{q,n} = H(h{q,n}, s_q^{(n)}) \).

  2. Re-score on Sampled Actions
    For sampled actions, scoring is performed in both the original context and the skill-augmented context. The Teacher model’s score is \( \log \pi_\theta(a|\hat{h}{q,n}) \), and the Student model’s score is \( \log \pi\theta(a|h_{q,n}) \). This operation is used to calculate the OPD Loss (\( \mathcal{L}_{OPD} \)), which converts probability shifts caused by skills into dense token-level online policy distillation signals.

  3. RL Loss and SEED Loss
    Additionally, the RL Loss (\( \mathcal{L}{RL} \)) is calculated, based on the Group-Relative Advantage, which is computed as \( A{q,n}^t = \frac{R(\tau_q^{(n)}) - \mu_q}{\sigma_q} \) (where \( R(\tau_q^{(n)}) \) is the trajectory reward, and \( \mu_q \) and \( \sigma_q \) are relevant statistics). Then, the SEED Loss (\( \mathcal{L}{SEED} = \mathcal{L}{RL} + \mathcal{L}_{OPD} \)) guides the policy update, resulting in an Updated Policy. This updated policy then serves as the new Actor and Analyzer, continuing to participate in the next round of the self-evolving loop, allowing the entire process to continuously optimize and enhance policy performance.

In summary, the SEED method consists of two phases. The first phase enables the policy to learn to extract hindsight skills through supervised fine-tuning. The second phase, through a self-evolving online policy distillation loop, distills the impact of skills back into the policy model while combining result-oriented reinforcement learning to achieve continuous optimization and self-evolution of the strategy.

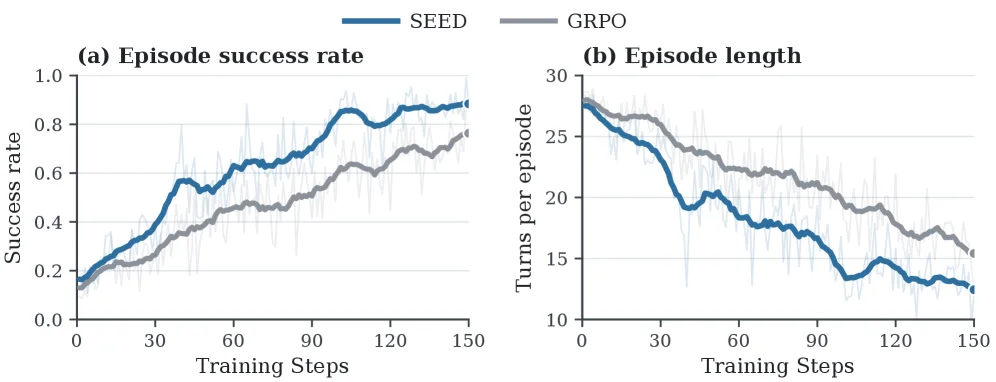
Figure 3: Training dynamics on ALFWorld. We compare Seed and GRPO using Qwen2.5-3B-Instruct as the backbone. Translucent curves show raw measurements, while solid curves show 13-point centered moving averages.

This figure (Figure 3) presents the training dynamics of our proposed SEED method and the baseline GRPO method on the ALFWorld task, using Qwen2.5-3B-Instruct as the backbone policy model.

First, let's examine the two subplots:

  • Subplot (a): Episode success rate

    • X-axis: Represents "Training Steps," ranging from 0 to 150. This indicates the progress of the reinforcement learning process, such as iterations or training epochs.
    • Y-axis: Represents "Success rate," ranging from 0.0 to 1.0. This measures the proportion of successful task completions by the policy model at each training step.
    • Curves:
      • The blue solid line represents the "SEED" method.
      • The gray solid line represents the "GRPO" baseline method.
      • The caption mentions: "Translucent curves show raw measurements, while solid curves show 13-point centered moving averages." This means the smooth curves we see are the result of smoothing the raw data (e.g., using a moving average) to better visualize trends.
    • Information Flow and Interpretation:
      • As training steps increase, both curves show an upward trend, indicating that the policy model is learning and improving its task success rate.
      • Crucially, the SEED method (blue curve) consistently outperforms the GRPO method (gray curve) throughout the training. For example, around training step 30, SEED's success rate is already above 0.4, while GRPO is around 0.3. By step 90, SEED's success rate is near 0.8, compared to GRPO's ~0.6. At the end of training (around step 150), SEED's success rate approaches 0.9, while GRPO is slightly below 0.8.
      • This demonstrates that SEED can more effectively utilize reinforcement learning signals to converge to a high-success-rate policy more quickly.
  • Subplot (b): Episode length

    • X-axis: Also represents "Training Steps," ranging from 0 to 150.
    • Y-axis: Represents "Turns per episode," which measures the average number of steps required to complete a task. Generally, a more efficient policy completes tasks in fewer steps.
    • Curves:
      • The blue solid line represents the "SEED" method.
      • The gray solid line represents the "GRPO" baseline method.
      • Again, translucent curves are raw data, and solid curves are 13-point centered moving averages.
    • Information Flow and Interpretation:
      • As training progresses, the episode lengths for both methods show a downward trend, indicating that the policies are optimizing and completing tasks in fewer steps.
      • Crucially, the SEED method (blue curve) consistently has shorter episode lengths than the GRPO method (gray curve) throughout training. For instance, around step 30, SEED's episode length is about 20, while GRPO's is around 23. By step 90, SEED's episode length drops to about 13, compared to GRPO's ~18. At the end of training (around step 150), SEED's episode length stabilizes around 12-13, while GRPO's is around 15-16.
      • This indicates that SEED not only achieves a higher success rate but also learns a more efficient policy, capable of completing tasks in fewer interaction steps.

How the method works (inferred from the results):

  1. Method Operation (Inferred):

    • SEED (Self-Evolving On-Policy Distillation) core idea is to convert completed "on-policy" trajectories into "hindsight skills." These skills are natural language descriptions that capture reusable workflows, critical decision points, or failure-avoidance rules.
    • During reinforcement learning, the current policy model not only collects trajectories but also acts as an analyzer to extract these hindsight skills from them.
    • Policy updates simultaneously improve subsequent decision-making and skill analysis capabilities, allowing "hindsight supervision" to evolve with the policy.
    • SEED re-scores sampled actions under ordinary and skill-augmented contexts, converting the probability shift induced by skills into a dense "token-level on-policy distillation signal." This signal is jointly optimized with the outcome-based RL objective, ensuring auxiliary supervision aligns with the current trajectory distribution.
    • From the figures, it's clear that SEED, through this mechanism, more effectively utilizes supervision at intermediate steps (via skills), leading to better performance in both success rate and efficiency compared to GRPO, which relies solely on sparse trajectory-level rewards.
  2. Conclusion:

    • The figure clearly shows that on the ALFWorld task, the SEED method outperforms the GRPO baseline in terms of both higher episode success rate (subplot a) and shorter episode length (subplot b) during training.
    • This demonstrates that the SEED framework effectively bridges the supervision gap between sparse trajectory-level rewards and token-level policy learning, thus learning superior and more efficient policies.
    • Specifically, SEED shows advantages early in training, and these advantages persist and expand, ultimately leading to significant improvements in both task completion quality and efficiency over GRPO.

In summary, this figure, by comparing key performance metrics (success rate and efficiency) of the two methods during training, intuitively demonstrates the superiority of the SEED method in solving long-horizon tasks involving multi-turn interaction and environmental feedback.

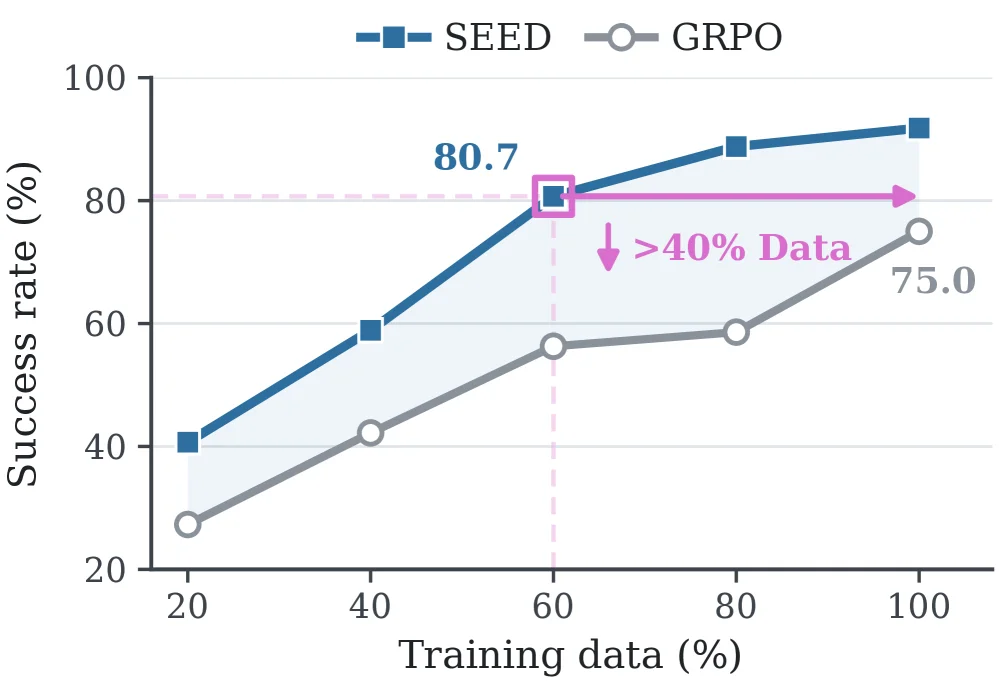
Figure 4: Sample efficiency analysis. Seed consistently outperforms GRPO across different data fraction settings and surpasses full-data GRPO using only 60% of the training data. Figure 5: Cross-domain generalizability on ALFWorld Unseen. Seed generally outperforms GRPO across unseen task types, demonstrating stronger cross-domain generalizability.

This figure (Figure 4) demonstrates the sample efficiency advantage of the SEED method by comparing the success rates of SEED and GRPO (a baseline) under different training data fraction settings, to reflect the sample efficiency of SEED.

Components of the Figure and Information Flow:

  • X - axis (Horizontal Axis): Represents "Training data (%)", that is, the proportion of training data, ranging from 20% to 100%, showing the situation when using different proportions of training data.
  • Y - axis (Vertical Axis): Represents "Success rate (%)", that is, the task success completion rate, with a range from 20% to 100%, measuring the performance of the method given the amount of training data.
  • Two Curves:
  • The blue curve with squares represents the SEED method, and the gray curve with circles represents the GRPO method (as a baseline for comparison).
  • The order of data points is that as the proportion of training data increases from 20% to 100%, the success rates of the two methods change step by step, reflecting the logic of "increase in data proportion → change in success rate", that is, as the amount of training data increases, the success rates of both methods increase, but SEED's improvement is more efficient.

Revelation of How the Method Works (Inferring Method Logic from the Figure Results):

From the figure, the sample efficiency advantage of SEED is reflected in: - When the proportion of training data is 60%, the success rate of SEED reaches 80.7%, while the success rate of GRPO at this time is about 56% (estimated from the position of the gray curve at the 60% data point). More importantly, the pink arrow and the text ">40% Data" in the figure indicate that SEED, with only 60% of the training data (that is, 40% less data than "full - data GRPO"? No, here "full - data GRPO" should refer to GRPO trained with 100% data? Wait, looking carefully: when SEED uses 60% data, its success rate (80.7%) exceeds the success rate of GRPO when using 100% data (75.0%). This shows that SEED can achieve or even exceed the performance of the baseline method (GRPO) with less training data, reflecting its sample efficiency. - Starting from a data proportion of 20%, the success rate of SEED (about 40%) is higher than that of GRPO (about 28%); as the data proportion increases to 40%, the success rate of SEED (about 60%) is much higher than that of GRPO (about 42%); when the data proportion is 60%, the success rate of SEED (80.7%) is significantly higher than that of GRPO (about 56%), and it exceeds the success rate of GRPO when using 100% data (75.0%); after that, when the data proportion is 80% and 100%, the success rate of SEED continues to increase (about 90%), while that of GRPO increases to about 75%.

Coordinates, Comparison Objects, and Conclusions:

  • Coordinates: The X - axis is the proportion of training data (20%, 40%, 60%, 80%, 100%), and the Y - axis is the task success completion rate (in percentage).
  • Comparison Objects: Two methods, SEED (blue curve) and GRPO (gray curve).
  • Conclusions:
  • Under all tested data proportions (20%, 40%, 60%, 80%, 100%), the task success completion rate of SEED is consistently higher than that of GRPO.
  • In particular, when SEED uses only 60% of the training data, its success completion rate (80.7%) exceeds the success completion rate of GRPO when using 100% of the training data (75.0%), which indicates that SEED can achieve or even surpass the performance of the baseline method with 40% less data (relative to GRPO's 100% data, here 60% is 40% less than 100%) , fully reflecting the sample efficiency of SEED (that is, achieving better or comparable performance with less training data).

Figure 4: Sample efficiency analysis. Seed consistently outperforms GRPO across different data fraction settings and surpasses full-data GRPO using only 60% of the training data. Figure 5: Cross-domain generalizability on ALFWorld Unseen. Seed generally outperforms GRPO across unseen task types, demonstrating stronger cross-domain generalizability.

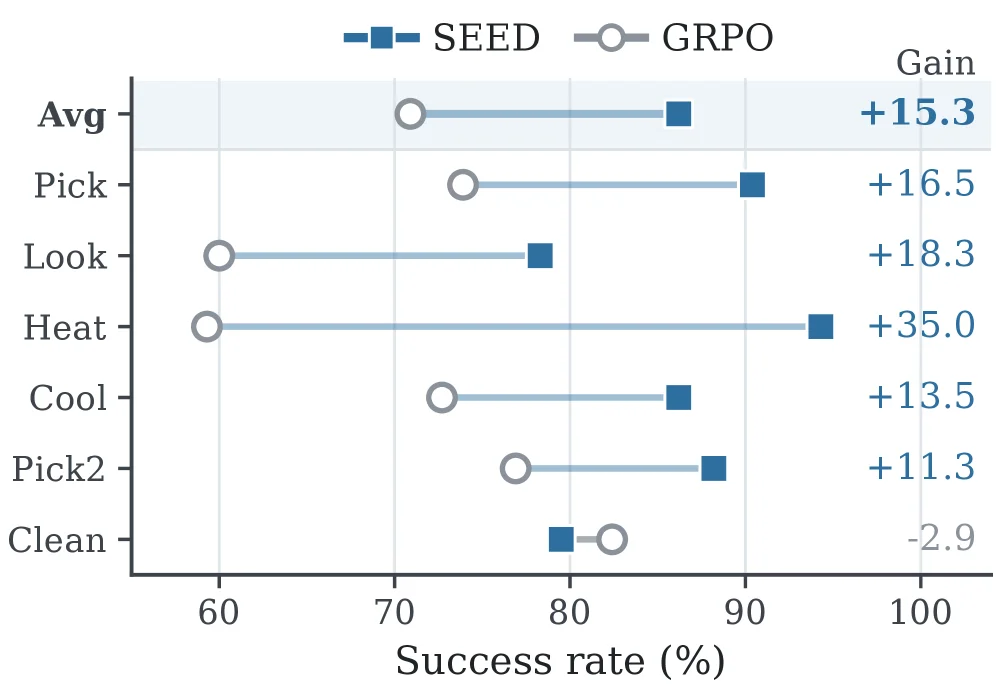
This figure (Figure 5) illustrates the cross-domain generalizability of the SEED method compared to the GRPO method on ALFWorld Unseen tasks. The horizontal axis represents the success rate (in percentage), while the vertical axis lists different task types, including Avg (average), Pick, Look, Heat, Cool, Pick2, and Clean. In the legend, blue squares represent the SEED method, and gray circles represent the GRPO method. Each pair of data points (a circle and a square) is connected by a line segment, indicating the performance difference between the two methods on the same task.

From the figure, it is evident that SEED achieves higher success rates than GRPO in most tasks. For instance, in the Heat task, SEED's success rate is close to 90%, while GRPO's is around 70%, with a gain of +35.0%; in the Pick task, SEED's success rate is approximately 90%, and GRPO's is around 75%, with a gain of +16.5%. The only exception is the Clean task, where SEED's success rate is slightly lower than GRPO's, with a gain of -2.9%.

This figure demonstrates how SEED exhibits stronger generalization capabilities across domain tasks. By comparing performance across multiple unseen task types, SEED achieves significant performance improvements in most tasks, indicating that SEED can better adapt to new environments and tasks, thus proving its robust cross-domain generalizability.

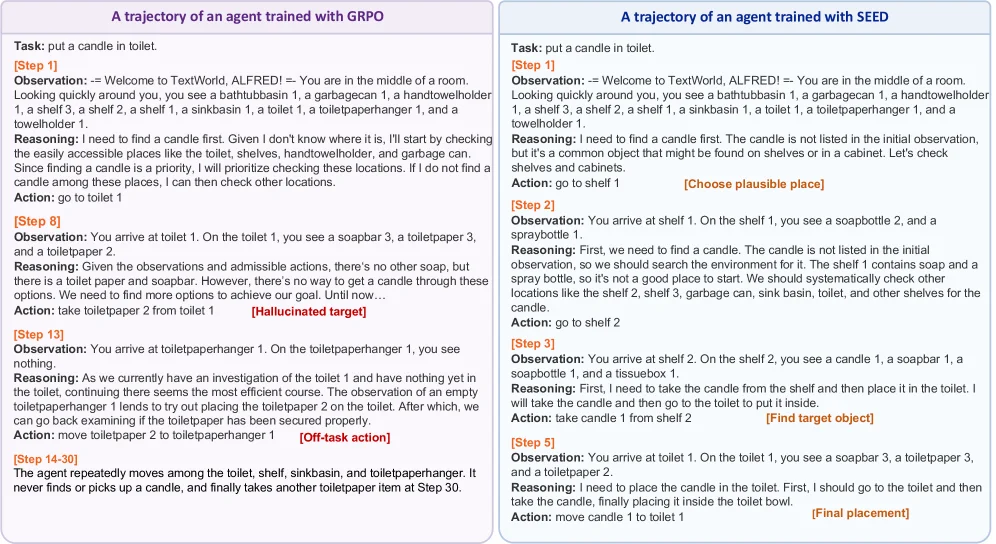
Figure 6: Qualitative comparison on ALFWorld. For the task “put a candle in toilet,” the GRPO- trained agent searches the target receptacle before locating the candle, takes an irrelevant toilet-paper item, and then enters an off-task loop. In contrast, SEED systematically checks plausible shelves, finds the candle, and completes the required placement in five steps.

This figure provides a qualitative comparison of two agents trained with different methods (GRPO and SEED) on the ALFWorld environment, specifically for the task "put a candle in toilet." The image is divided into two main panels, each illustrating the step-by-step trajectory of an agent:

Left Panel: Trajectory of an agent trained with GRPO This panel shows the decision-making process of an agent trained with GRPO (a reinforcement learning algorithm) while attempting the task. 1. [Step 1]: The agent receives an initial observation of the room (e.g., bathtub, garbage can, towel holders). Its reasoning is to first find the candle by checking easily accessible places like shelves, sinks, or trash cans. It takes the action "go to toilet 1." 2. [Step 8]: The agent arrives at toilet 1 and observes items like a soap bar and toilet paper. Its reasoning states there's no candle, so it decides to take "toiletpaper 2 from toilet 1." This step is marked "[Hallucinated target]," indicating it mistakenly focused on a toilet paper item as if it were related to the main task. 3. [Step 13]: The agent is at a toiletpaperhanger 1 (empty) and reasons that since progress on the toilet is stalled, it should try placing the previously taken toilet paper there. It takes the action "move toiletpaper 2 to toiletpaperhanger 1," marked "[Off-task action]" because it doesn't contribute to finding the candle. 4. [Step 14-30]: The agent repeatedly moves between the toilet, shelf, sink, and toiletpaperhanger without finding or picking up the candle, eventually taking another toilet paper-like item at Step 30. This is described as an "off-task loop."

Right Panel: Trajectory of an agent trained with SEED This panel shows the decision-making process of an agent trained with the SEED method for the same task. 1. [Step 1]: The agent receives the same initial observation and reasons that the candle is likely on a shelf or in a cabinet. It takes the action "go to shelf 1," marked "[Choose plausible place]," showing a more targeted decision. 2. [Step 2]: The agent arrives at shelf 1 and observes a soap bottle and spray bottle. Its reasoning states these are not the candle, so it should systematically search other locations like shelf 2, shelf 3, etc. This indicates a systematic search approach. 3. [Step 3]: The agent takes the action "go to shelf 2." 4. [Step 4]: The agent arrives at shelf 2 and observes a candle, among other items. Its reasoning is clear: it needs to take the candle from the shelf to put it in the toilet. It takes the action "take candle 1 from shelf 2," marked "[Find target object]." 5. [Step 5]: The agent arrives at toilet 1. Its reasoning is to place the candle inside the toilet bowl, and it takes the action "move candle 1 to toilet 1," marked "[Final placement]." The task is completed in 5 steps.

How the Method Works (Revealed by the Figure) The figure reveals how SEED operates by demonstrating its effectiveness: * Systematic Search & Target Identification: The SEED-trained agent systematically checks plausible locations (shelves) and accurately identifies the target object (candle). In contrast, the GRPO-trained agent makes misguided choices or gets stuck in irrelevant loops. * Effective Decision-Making & Task Completion: The SEED agent's actions are goal-oriented and efficient, leading to quick task completion. The GRPO agent exhibits poor decision-making, performing unrelated actions and getting trapped in cycles. * Evolution of Supervision Signals: While the internal mechanisms of SEED (like skill extraction and distillation) aren't explicitly shown, the comparison implies that SEED converts completed trajectories into "hindsight skills" (e.g., "choose plausible place," "systematically search," "find target object," "final placement") and uses these to provide denser supervision to the policy model, guiding better decisions. These skills are reflected in the SEED agent's reasoning and actions.

Conclusion The figure clearly demonstrates that for the task "put a candle in toilet," the SEED-trained agent is more effective at searching for the target, identifying the object, and completing the task, achieving it in just 5 steps. The GRPO-trained agent, however, shows flawed decision-making, performs irrelevant actions, and gets stuck in an off-task loop. This visually illustrates the advantage of the SEED method in solving long-horizon tasks and improving decision quality.

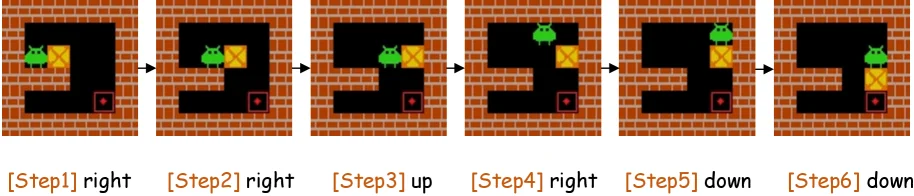
Figure 7: A representative trajectory on Sokoban. The sequence shows six consecutive actions executed by the agent. Arrows indicate the temporal progression of the trajectory, and the action taken at each step is displayed below the corresponding observation.

This figure (Figure 7) from the paper "SEED: Self-Evolving On-Policy Distillation for Agentic Reinforcement Learning" illustrates a typical agent trajectory in the Sokoban (pushbox) environment. It clearly demonstrates, through six consecutive steps, how an agent executes a sequence of actions to achieve a goal (although the goal itself might not be fully shown in this simplified example, the action sequence illustrates the decision-making process).

Let's break down the figure step by step:

  1. Overall Structure: The figure consists of six side-by-side panels, arranged from left to right, representing the temporal order of events. Each panel contains a game scene (observation state) and a corresponding action description.
  2. Game Scene (Observation State):
    • The main part of each panel is a typical Sokoban game map. The map is composed of brick walls (brown squares), movable black spaces, a green Sokoban agent (character), a yellow box, and a red target point (usually the position where the box needs to be pushed).
    • From left to right, we can observe the changes in the positions of the agent and the box:
      • Step 1: The agent is on the left side of the map, and the box is to the right of the agent. The red target point is located in a corner below the box.
      • Step 2: The agent moves one step to the right, getting closer to the box.
      • Step 3: The agent moves one step up, now positioned above the box.
      • Step 4: The agent moves one step to the right again. At this point, it is directly above the box, and the box has also moved one step to the right, closer to the target point.
      • Step 5: The agent moves one step down, returning to the same horizontal line as the box, but the box continues its rightward movement.
      • Step 6: The agent moves down once more, while the box is pushed onto the red target point.
  3. Action Description and Data Flow:
    • Below each game scene panel, there is a label such as "[Step1] right," "[Step2] right," etc. These labels clearly indicate the action taken by the agent at that step.
    • Arrows (→) are placed between each panel, pointing from left to right, visually representing the passage of time and the continuity of the action sequence. The flow of data or information is from left to right, representing the transition from one state to the next, caused by the agent's actions.
  4. Revealing How the Method Works:
    • Although this figure itself is an example trajectory, it is closely related to the SEED method proposed in the paper. The core idea of SEED is to leverage completed policy trajectories (like the action sequence shown in this figure) to extract "hindsight skills" and distill the behavioral effects of these skills back into the policy model.
    • This figure can be seen as an instance of a "completed trajectory." In the SEED framework, such a trajectory would be analyzed:
      • Skill Extraction: The system would analyze this trajectory to identify key decision points, successful patterns, or rules for avoiding failure, and express them as natural language skills. For example, from this figure, possible skills extracted could be "When the box is near a target, adjust its position to align with the target" or "Achieve the goal by pushing the box rather than moving directly to the target."
      • Policy Update: These extracted skills are then used as auxiliary supervision signals, optimized together with the outcome-based Reinforcement Learning (RL) objective to update the policy model. This way, the policy learns not only how to obtain high rewards but also how to execute the intermediate steps (i.e., skills) that lead to success.
      • Distillation Signal: SEED converts the probability shift caused by skills into a dense token-level on-policy distillation signal by re-scoring sampled actions under ordinary and skill-augmented contexts. The action sequence in this figure provides concrete examples for such an evaluation.
    • Therefore, this figure reveals a key premise of the SEED method: trajectories executed by the agent in the environment contain valuable information that can be used to improve the policy, not just as a basis for final rewards. By analyzing and distilling the behavior in these trajectories, the policy can learn more effective decision-making strategies, thus performing better in similar tasks.

In summary, this figure uses a specific Sokoban game trajectory example to show how an agent interacts with the environment through a sequence of actions. More importantly, it serves as a visual example to illustrate how the SEED method utilizes such completed trajectories to extract useful behavioral patterns (skills) and convert them into supervision signals to improve policy learning, thereby bridging the gap in intermediate decision guidance provided by outcome-based RL.

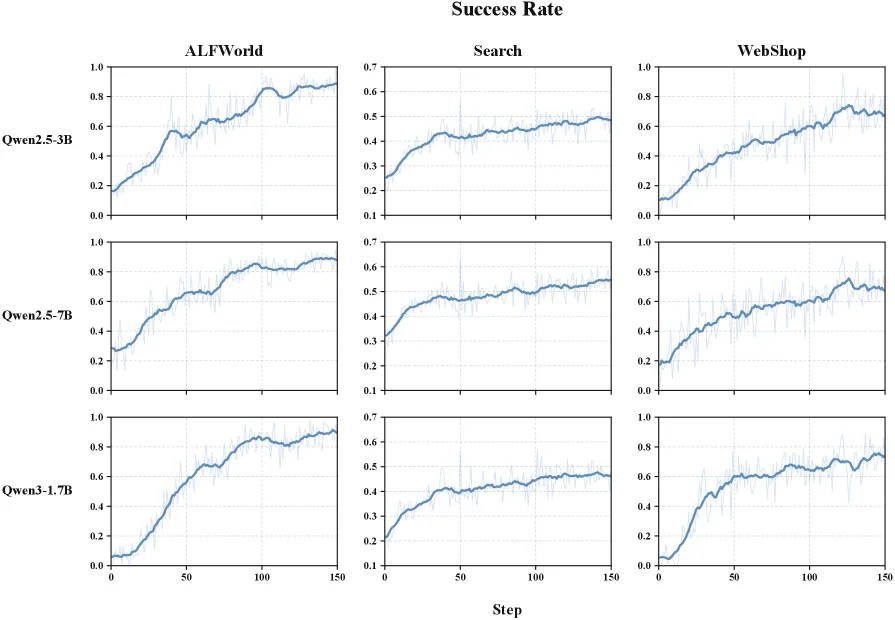
Figure 8: Success rates across three backbones and three domains. Success rates increase over training in all nine settings, showing consistent learning across model scales and agentic tasks.

This figure (Figure 8) illustrates the success rates across three different model "backbones" and three different task domains as training progresses. The title "Success Rate" indicates that the core content of the graph is to show the learning performance over time.

First, let's examine the structure of the graph. It consists of nine subplots arranged in a 3x3 grid. Each row represents a specific model backbone, from top to bottom: 1. First row: Qwen2.5-3B model. 2. Second row: Qwen2.5-7B model. 3. Third row: Qwen3-1.7B model.

Each column represents a specific task domain, from left to right: 1. First column: ALFWorld domain. 2. Second column: Search domain. 3. Third column: WebShop domain.

Each subplot is a line graph where the x-axis ("Step") represents the training steps, ranging from 0 to approximately 150. The y-axis ("Success Rate") represents the success rate, with ranges varying by domain but typically from 0 to 1 (or close to 1). For example, the ALFWorld domain has a y-axis range from 0 to 1.0, while the Search domain has a y-axis range from 0 to 0.7.

The blue line in each graph represents how the success rate of the policy changes with increasing training steps for a specific model and domain combination. We can observe the following:

  • Overall Trend: In all nine settings (i.e., each model-domain combination), the success rate increases with the number of training steps. This indicates that the method achieves consistent learning effects across different model scales and different agent tasks.
  • Comparison Between Models:
    • In the ALFWorld domain, the success rate for the Qwen2.5-3B model starts near 0 and gradually rises to about 0.9.
    • The Qwen2.5-7B model shows a similar success rate curve but achieves a slightly higher final success rate, approaching 1.0.
    • The Qwen3-1.7B model also exhibits an increasing trend, with a final success rate approaching 0.9.
    • This suggests that an increase in model scale may lead to some performance improvement, but different model sizes can effectively learn.
  • Comparison Between Domains:
    • Success rates in the ALFWorld domain are generally higher, ultimately approaching or reaching 1.0.
    • Success rates in the Search domain are relatively lower, ultimately falling between 0.5 and 0.6.
    • Success rates in the WebShop domain are intermediate, ultimately between 0.6 and 0.8.
    • This indicates that there may be differences in learning difficulty across different task domains.

Does this figure reveal how the SEED method specifically works? While the figure itself primarily shows results, it indirectly supports the effectiveness of the SEED method proposed in the paper. The core idea of SEED is to convert completed policy trajectories into "hindsight" skills through a self-evolving mechanism and distill the behavioral effects of these skills back into the policy model. The results shown in the figure, where success rates improve with training, suggest that the SEED method can effectively use these skills to enhance the decision-making capability of the policy.

Specifically, each subplot corresponds to a specific model and task domain combination. The x-axis "Step" represents the training progress, and the y-axis "Success Rate" measures the policy's performance at that stage. The upward trend of the blue line indicates that as training progresses, the policy's success rate in completing tasks increases. This demonstrates that the SEED method can continuously optimize the policy during training, making it better suited to the task requirements.

In summary, this figure demonstrates, through the improvement trends of success rates across different models and domains, that the SEED method achieves consistent and effective learning across different model scales and agent tasks. The success rate in all nine settings increases with the number of training steps, indicating good generalization ability and learning efficiency of the method.

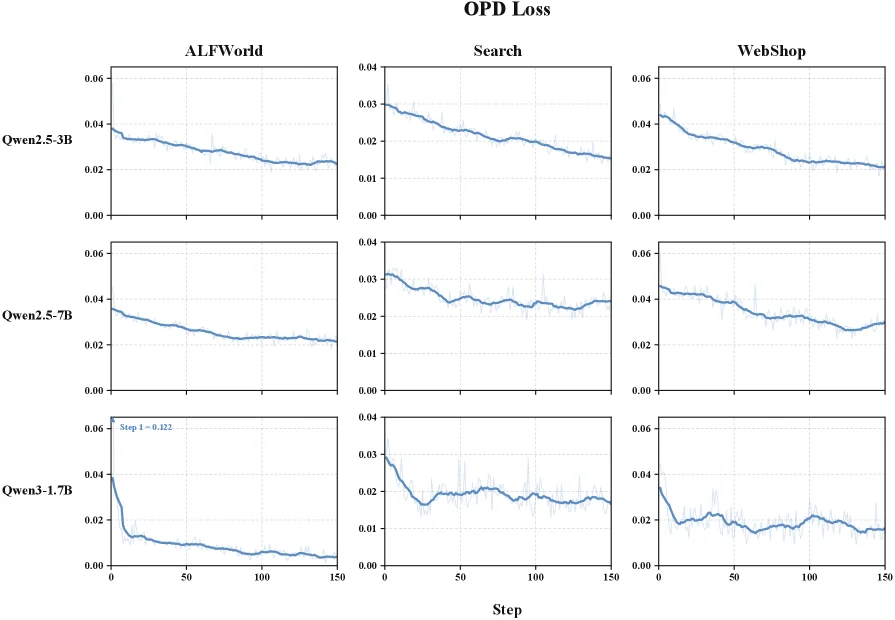
Figure 9: OPD loss dynamics. The loss generally decreases and stabilizes during training, indicating that the policy progressively internalizes the behavioral guidance provided by hindsight skills.

This figure (Figure 9) illustrates the dynamics of OPD (On-Policy Distillation) loss during the training process of the SEED framework proposed in the paper. We can interpret this figure in detail as follows:

  1. Chart Structure and Content:

    • This is a grid of subplots. The x-axis (Step) represents the training steps, ranging from 0 to approximately 150 steps. The y-axis (Loss) represents the OPD loss value. Different subplots have slightly different y-axis scales, but all show the trend of loss value changes with training steps.
    • The chart is divided into three rows, each representing a different base model:
      • First row: Qwen2.5-3B
      • Second row: Qwen2.5-7B
      • Third row: Qwen3-1.7B
    • The chart is divided into three columns, each representing a different task or environment:
      • First column: ALFWorld
      • Second column: Search
      • Third column: WebShop
    • Therefore, there are a total of 3 (models) x 3 (tasks) = 9 subplots, each showing the OPD loss curve for a specific model on a specific task.
  2. Data Flow and Interpretation:

    • The blue curve in each subplot represents the change in OPD loss value as the training steps (Step) increase during training.
    • We observe that for all models and all tasks, the OPD loss value is typically high in the early stages of training, then gradually decreases as training progresses, and eventually stabilizes.
    • For example, in the subplot for "Qwen2.5-3B" model on the "ALFWorld" task (first row, first column), the loss starts at around 0.04 and gradually decreases to near 0.02 and remains stable as the number of steps increases.
    • Similarly, other subplots also show a similar trend: the loss value decreases with an increasing number of training steps, indicating that the model is optimizing during the learning process.
  3. Revealing Method Operation:

    • This figure reveals the optimization process of the OPD loss within the SEED framework. According to the paper's abstract, the SEED framework converts completed policy trajectories into "hindsight skills" and distills the behavioral effects of these skills back into the policy model.
    • The OPD loss is a key signal in this distillation process. The decrease in loss indicates that the policy model is effectively learning and internalizing the behavioral guidance provided by these "hindsight skills."
    • Specifically, the policy model collects trajectories and also acts as an analyzer to extract "hindsight skills" from these trajectories. Policy updates not only improve subsequent decision-making but also enhance skill analysis capabilities, allowing hindsight supervision to evolve with the policy.
    • The consistent downward trend and eventual stabilization of the loss in the figures suggest that the policy model is gradually incorporating these skills into its own behavioral patterns, thereby improving the quality of intermediate decisions without relying on sparse trajectory-level rewards.
  4. Comparison Objects and Conclusion:

    • The comparison objects are different models (Qwen2.5-3B, Qwen2.5-7B, Qwen3-1.7B) and different tasks (ALFWorld, Search, WebShop).
    • Although the specific loss values and rates of decrease may vary across different models and tasks, all subplots show a consistent trend: the OPD loss generally decreases and stabilizes during training.
    • The conclusion is that the OPD loss typically reduces and stabilizes during training, indicating that the policy model is progressively internalizing the behavioral guidance provided by hindsight skills. This demonstrates the effectiveness of the distillation mechanism in the SEED framework, helping the policy model learn better decision-making strategies.

In summary, this figure visually demonstrates the effectiveness of the on-policy distillation process in the SEED framework by showing how OPD loss changes with training steps for different models and tasks. The decrease and stabilization of the loss indicate that the policy model is successfully learning and utilizing the "hindsight skills," thereby optimizing its decision-making capabilities.

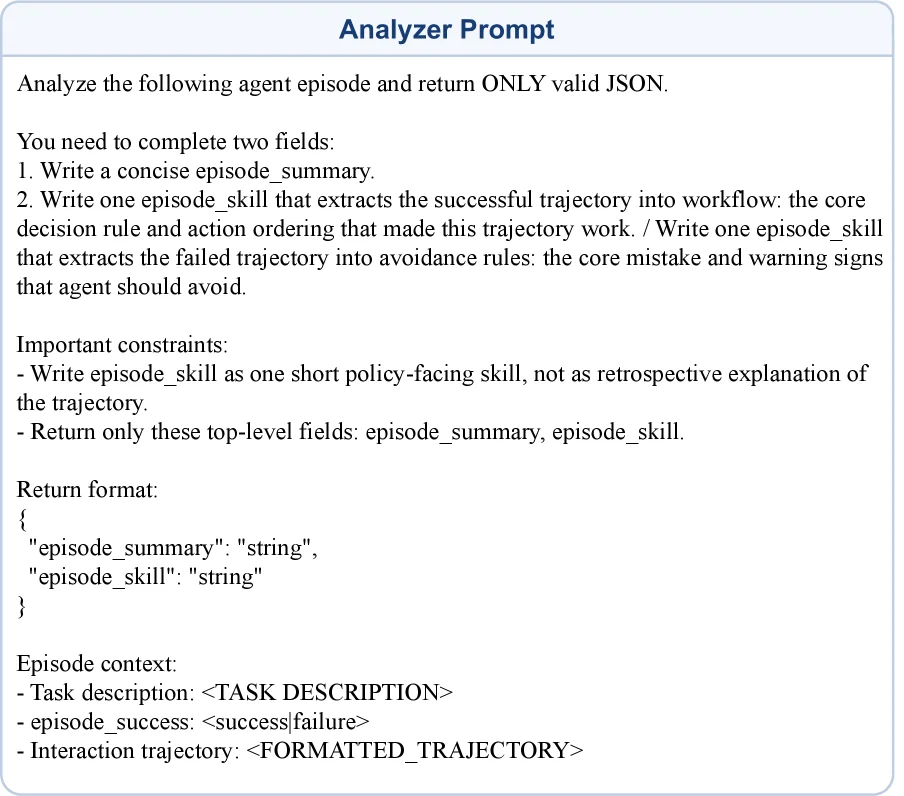
Figure 10: Prompt of analyzer.

This diagram illustrates the Analyzer Prompt design from the paper SEED: Self-Evolving On-Policy Distillation for Agentic Reinforcement Learning. It serves as a critical input template for the core process in the SEED framework, which transforms completed trajectories into hindsight skills. The prompt guides language models to analyze an agent’s interaction history and output structured skill information. Here’s a breakdown of its logic and workflow:

1. Core Objectives and Constraints

  • Objective: The analyzer (typically a large language model) must analyze an agent’s episode (a single interaction cycle) and return only valid JSON data containing two key fields: episode_summary (trajectory summary) and episode_skill (hindsight skill).
  • Constraints:
  • episode_skill must be a policy-facing, concise rule (not a post-hoc explanation of the trajectory). It should extract actionable decision logic rather than describing "what happened."
  • Only the specified top-level fields (episode_summary and episode_skill) are returned to ensure clarity and parseability for downstream processes.

2. Input and Output Structure

  • Input (Episode Context): The analyzer requires three pieces of information to generate output:
  • Task description: A description of the task (placeholder: <TASK DESCRIPTION>, replaced with specifics like "Query weather and compile a report" during execution).
  • episode_success: The outcome of the interaction (success/failure, placeholder: <success|failure>, actual values: success or failure).
  • Interaction trajectory: A record of the agent’s interactions during the episode (placeholder: <FORMATTED_TRAJECTORY>, e.g., "User asks ‘Beijing weather?’ → Agent calls weather API → Returns results → User confirms").
  • Output (Return Format): A JSON object must be returned, containing:
  • episode_summary: A concise summary of the trajectory (e.g., "Agent successfully queried Beijing weather and returned results, using the weather API during the process").
  • episode_skill: The hindsight skill extracted from the trajectory. For successful trajectories, this is a "successful decision rule and action sequence" (e.g., "When a user asks about weather, first call the weather API, then return results"). For failed trajectories, it is a "rule to avoid failure" (e.g., "When a user needs real-time weather, avoid cached data and always call the live API").

3. Methodology and Framework Context

The SEED framework’s core is self-evolving policy distillation: transforming "completed policy trajectories" into "hindsight skills" and distilling their behavioral effects back into the policy model. This addresses the problem of "sparse trajectory-level rewards that fail to guide intermediate decisions" in reinforcement learning (RL). The "Analyzer Prompt" in this diagram is the first step in this process:
- The analyzer (via the language model) generates episode_summary and episode_skill based on inputs (task description, trajectory outcome, interaction trajectory) while adhering to constraints.
- The generated episode_skill is used for subsequent policy updates: In RL, the current policy collects new trajectories while also acting as an "analyzer" to extract hindsight skills from them (enabling co-evolution of "policy updates" and "skill analysis"). Later, SEED converts the probability shift caused by skills into dense token-level policy distillation signals using differences in action scores between "skill-enhanced context" and "plain context." These signals are jointly optimized with "result-based RL" to align auxiliary supervision with the current trajectory distribution.

4. Information Flow and Component Roles

  • Information Flow: Input (task description → trajectory outcome → interaction trajectory) → Analyzer (generates output via prompt) → Output (JSON-formatted episode_summary and episode_skill) → Downstream processes (skills used for policy updates and distillation).
  • Component Roles:
  • Analyzer Prompt: An "instruction template" for the analyzer, defining input/output formats and constraints to ensure the output is usable by subsequent SEED steps.
  • episode_summary: Provides a "high-level understanding" of the trajectory, summarizing its core content.
  • episode_skill: Offers "reusable behavioral logic," the heart of SEED’s self-evolving distillation. It bridges the gap between "trajectory-level experience" and "token-level policy guidance" by converting "episode-level outcomes" into "actionable supervision" for strategy learning.

5. Key Takeaways (From the Diagram’s Insights)

The diagram reveals the critical "trajectory → skill → policy update" loop in SEED: A well-designed analyzer prompt enables large language models to extract structured "hindsight skills" from interaction histories. These skills guide current policy decisions during RL while being used to generate new distillation signals for strategy optimization. This achieves co-evolution of "policy" and "skill analysis," addressing the lack of intermediate decision supervision in reinforcement learning. The analyzer’s prompt ensures extracted skills are "actionable and reusable" by constraining output format and content type, providing high-quality supervision for subsequent policy distillation.

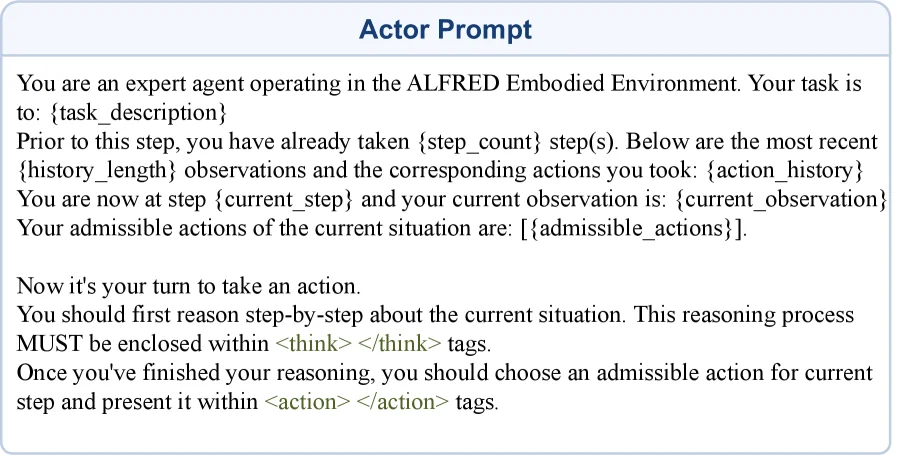
Figure 11: Prompt of actor (the policy model) in ALFWorld.

This diagram illustrates the prompt structure of the actor (policy model) in the ALFWorld environment, serving as the core interactive interface for policy-based reinforcement learning (RL) processes described in the paper SEED: Self-Evolving On-Policy Distillation for Agentic Reinforcement Learning. It guides the policy model on how to make decisions within the environment. Its working logic can be broken down into the following components:

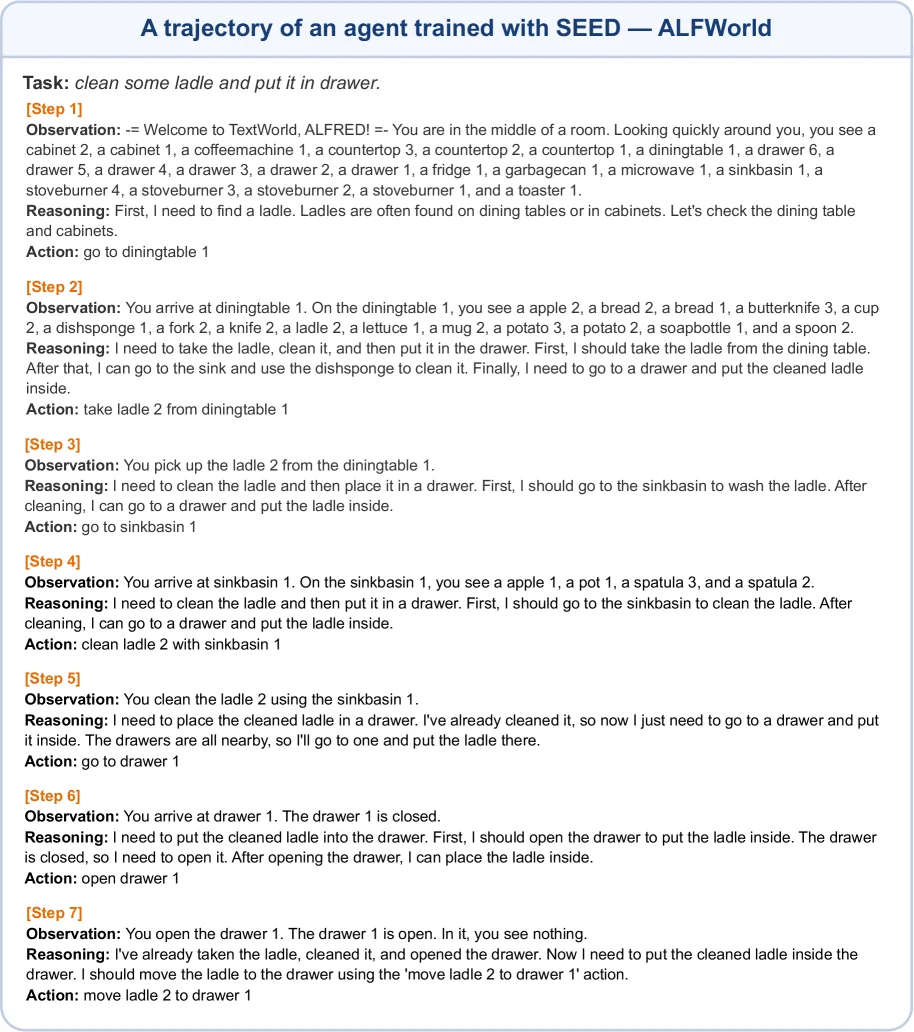
Figure 12: ALFWorld Example 1. Seed locates and cleans the ladle, opens the closed drawer, and completes the placement in seven steps, demonstrating task decomposition and correct precondition handling.

This diagram illustrates the complete trajectory of an agent trained using the SEED method completing the task "clean some ladle and put it in drawer" in the ALFWorld environment, clearly demonstrating how the agent decomposes tasks through a series of steps and handles preconditions.

The structure of the diagram is a table organized by steps (Step), with each step containing three key parts: Observation, Reasoning, and Action, which are arranged in sequence to show the agent's decision-making process from the start to the completion of the task.

  1. Task Description: At the top of the diagram, the task goal is clearly stated: "clean some ladle and put it in drawer" (clean a ladle and put it in a drawer). This is the final goal that the agent needs to achieve.

  2. Step-by-Step Breakdown:

    • Step 1: The agent first observes that it is in a room with various objects (such as cabinets, a coffee machine, a countertop, a dining table, drawers, etc.). Based on the reasoning that "ladles are usually on the dining table or in cabinets," the agent decides to "go to diningtable 1" (go to dining table 1). This step shows how the agent selects the initial action based on environmental observations and common-sense reasoning.
    • Step 2: The agent arrives at dining table 1 and observes objects on the table such as an apple, bread, a butter knife, a cup, a dishwashing sponge, a fork, a knife, and a ladle (ladle 2). The reasoning part clearly indicates that the ladle needs to be picked up from the table, then cleaned and put in a drawer. Therefore, the agent performs the action "take ladle 2 from diningtable 1" (take ladle 2 from dining table 1). This step shows how the agent identifies the target object and takes the corresponding action.
    • Step 3: After successfully picking up the ladle, the agent reasons that it needs to go to the sink to clean the ladle. So it performs the action "go to sinkbasin 1" (go to sink basin 1). This step shows how the agent plans the next cleaning action.
    • Step 4: The agent arrives at sink basin 1 and observes objects in the sink such as an apple, a pot, and a spatula. The reasoning part again emphasizes the need to clean the ladle, so it performs the action "clean ladle 2 with sinkbasin 1" (clean ladle 2 with sink basin 1). This step shows how the agent performs the cleaning task.
    • Step 5: After the ladle is cleaned, the agent reasons that the ladle needs to be put in a drawer. Since drawers are usually closed, it decides to go to drawer 1 and performs the action "go to drawer 1" (go to drawer 1). This step shows how the agent plans the action of placing the ladle.
    • Step 6: The agent arrives at drawer 1 and observes that the drawer is closed. The reasoning part points out that the drawer needs to be opened to put in the ladle, so it performs the action "open drawer 1" (open drawer 1). This step shows how the agent handles preconditions (opening the drawer).
    • Step 7: After opening the drawer, the agent observes that the inside of the drawer is empty. The reasoning part clearly indicates that the cleaned ladle needs to be put in the drawer, so it performs the action "move ladle 2 to drawer 1" (move ladle 2 to drawer 1). This step shows how the agent completes the final task.
  3. Revealing How the Method Works:

    • Task Decomposition: Through the reasoning part of each step, we can see how the agent decomposes a complex task (cleaning a ladle and putting it in a drawer) into a series of simple subtasks (finding the ladle, picking up the ladle, cleaning the ladle, finding the drawer, opening the drawer, putting in the ladle). Each subtask corresponds to a clear observation and action.
    • Handling Preconditions: In each step, the agent considers the current preconditions (such as whether the drawer is closed) and takes corresponding actions to meet these conditions (such as opening the drawer). For example, in Step 6, the agent realizes that the drawer is closed, so it first performs the action of opening the drawer and then puts in the ladle.
    • Embodiment of the SEED Method: This diagram shows how the SEED method converts the completed task trajectory into "hindsight skills" during training and distills the behavioral effects of these skills back into the policy model. In this example, the agent generates natural language skills that can capture reusable workflows (such as "find ladle → pick up ladle → clean ladle → find drawer → open drawer → put in ladle") by analyzing the completed trajectory (i.e., the step sequence in the diagram). During the reinforcement learning (RL) process, the current policy both collects trajectories and acts as an analyzer to extract these hindsight skills from the trajectories, thereby improving subsequent decision-making and skill analysis.
  4. Result Presentation:

    • Coordinate/Comparison Object: There are no explicit coordinates or comparison objects in the diagram, but the process of the agent completing the task within seven steps is shown through the step sequence.
    • Conclusion: The results in the diagram show that the agent trained using the SEED method can successfully decompose tasks and handle preconditions, and finally complete the task of "cleaning a ladle and putting it in a drawer" within seven steps. This verifies the effectiveness of the SEED method in long-horizon tasks, especially in terms of task decomposition and precondition handling.

In summary, this diagram, through a specific example, shows how the SEED method enables an agent to complete complex tasks in the ALFWorld environment, reveals the specific operation mode of the method, and proves its effectiveness in task decomposition and precondition handling.

Figure 13: ALFWorld Example 2. Seed places two books through repeated trips between the desk and bed while retaining the completed first placement, demonstrating progress tracking over an extended trajectory.

This figure, from the paper "SEED: Self-Evolving On-Policy Distillation for Agentic Reinforcement Learning," illustrates a complete trajectory of an agent trained with SEED performing the task "put two book in bed" in the ALFWorld environment. It clearly explains how the SEED method operates by showing the agent's observation (Observation), reasoning (Reasoning), and action (Action) at each step, organized sequentially.

First, the structure of the figure is step-by-step, from Step 1 to Step 8. Each step contains three key components: observation, reasoning, and action. These components flow in chronological order, demonstrating how the agent interacts with the environment to complete the task.

In the Task section, the goal is clearly stated: "put two book in bed," which means placing two books on the bed.

Step 1: - Observation: The agent starts in the middle of a room and sees items like a bed, a desk, drawers, etc. - Reasoning: The agent needs to find two books and place them on the bed. It identifies the desk and shelves as good starting points. - Action: go to desk 1, meaning the agent moves to desk 1.

Step 2: - Observation: The agent arrives at desk 1 and sees book 1, book 2, and other items on it. - Reasoning: The agent plans to first take book 1 and book 2 from the desk and then go to the bed to place them. - Action: take book 1 from desk 1, meaning the agent picks up book 1 from desk 1.

Step 3: - Observation: The agent has picked up book 1 from desk 1. - Reasoning: The agent has the first book and now needs to go to the bed to place it before going back for the second book. - Action: go to bed 1, meaning the agent moves to bed 1.

Step 4: - Observation: The agent arrives at bed 1 and sees items like cellphones, a laptop, a pillow, etc., on it. - Reasoning: The agent needs to first place the already taken book 1 on the bed and then go back to get book 2. - Action: move book 1 to bed 1, meaning the agent places book 1 on bed 1.

Step 5: - Observation: The agent successfully places book 1 on bed 1. - Reasoning: The agent now needs to return to desk 1 to get the second book (book 2). - Action: go to desk 1, meaning the agent moves back to desk 1.

Step 6: - Observation: The agent arrives at desk 1 again and sees book 2 still there. - Reasoning: The agent plans to take book 2 from desk 1 and then go to the bed to place it. - Action: take book 2 from desk 1, meaning the agent picks up book 2 from desk 1.

Step 7: - Observation: The agent has picked up book 2 from desk 1. - Reasoning: The agent needs to place book 2 on bed 1. - Action: go to bed 1, meaning the agent moves to bed 1.

Step 8: - Observation: The agent arrives at bed 1 and sees book 1 is already there. - Reasoning: The agent needs to place book 2 on the bed as well to complete the task. - Action: move book 2 to bed 1, meaning the agent places book 2 on bed 1.

This figure reveals how the SEED method works: the agent makes multiple round trips between the desk and the bed to complete the task step by step. At each step, the agent observes the current state, reasons about the next action, and decides accordingly. This method demonstrates how the agent can track progress in long-horizon tasks, retain completed operations (like placing book 1 in the first step), and continue with subsequent steps (like placing book 2). This is a core idea of the SEED method: by converting completed trajectories into reusable skills and distilling their behavioral effects back into the policy model, SEED enables self-evolving policy improvement. The agent's action sequence in the figure clearly shows this gradual learning and decision-making process, proving that an agent trained with SEED can successfully handle complex, multi-step tasks like placing two books on a bed while effectively tracking progress and leveraging existing knowledge.

This is not a traditional result figure with coordinates, comparison objects, or statistical conclusions. It is an example figure used to illustrate the application and effectiveness of the SEED method in the ALFWorld environment. The conclusion is that an agent trained with SEED can successfully complete complex, multi-step tasks, such as placing two books on a bed, and can effectively track progress and utilize existing knowledge during the process.

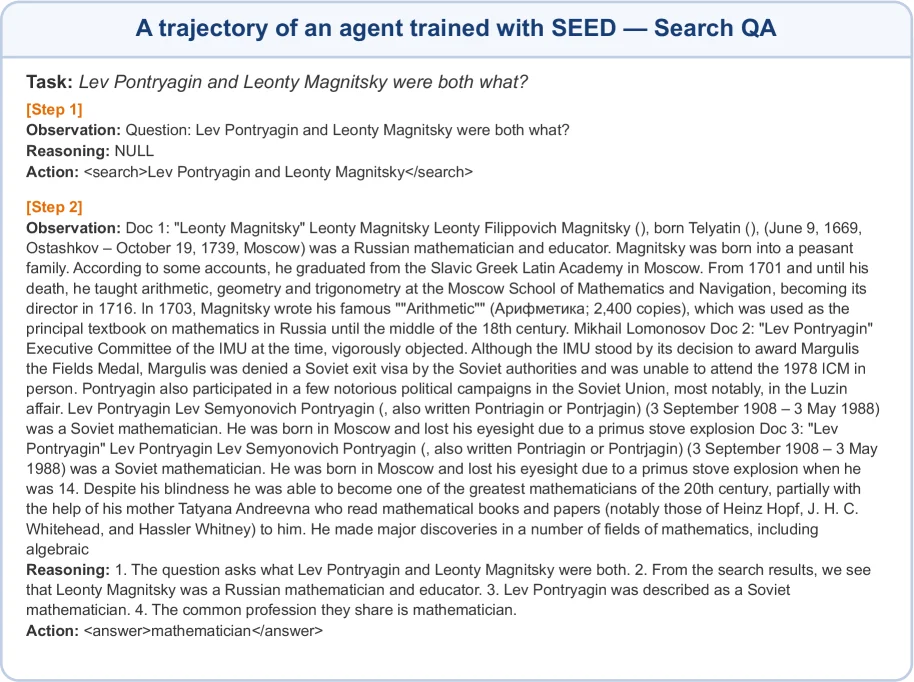
Figure 14: Search-based QA Example 1. A single query retrieves evidence that both people are mathematicians, allowing Seed to answer without unnecessary searches.

mathematician

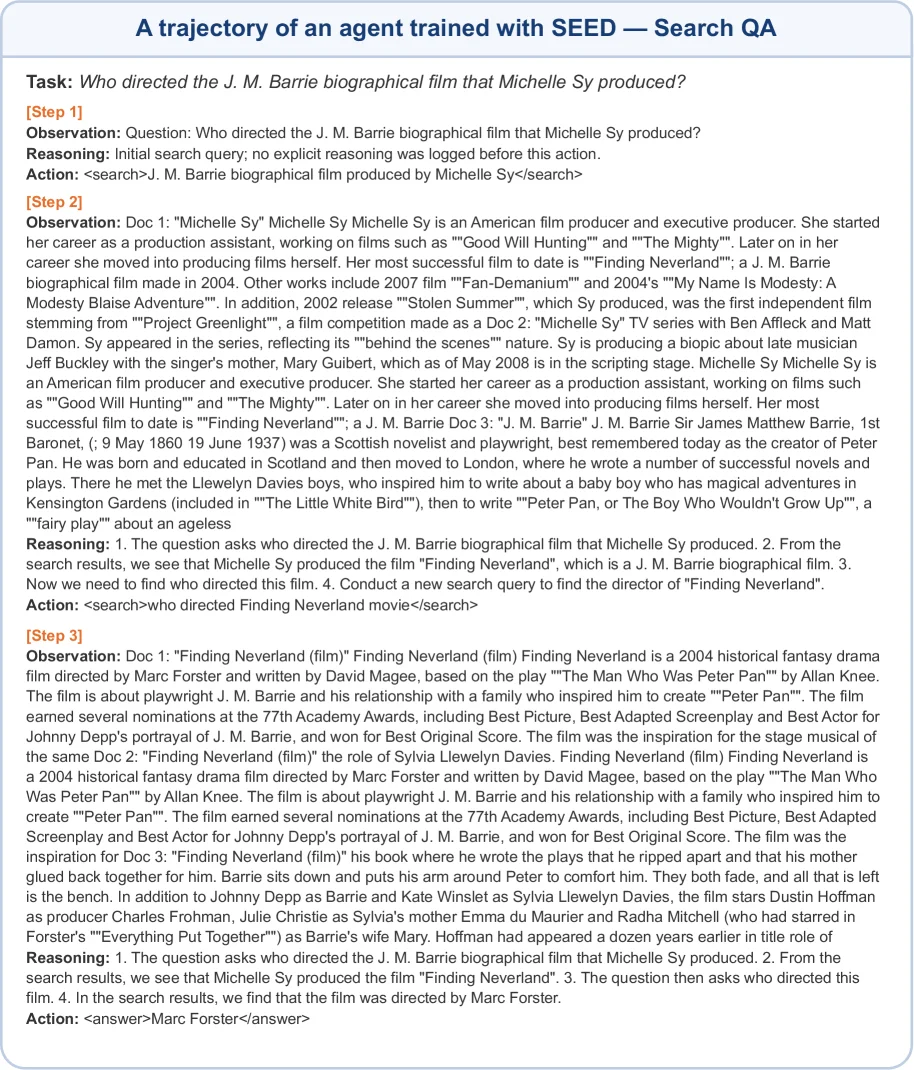
Figure 15: Search-based QA Example 2. Seed first identifies Finding Neverland , then performs a targeted second search to verify that Marc Forster directed the film.

Marc Forster

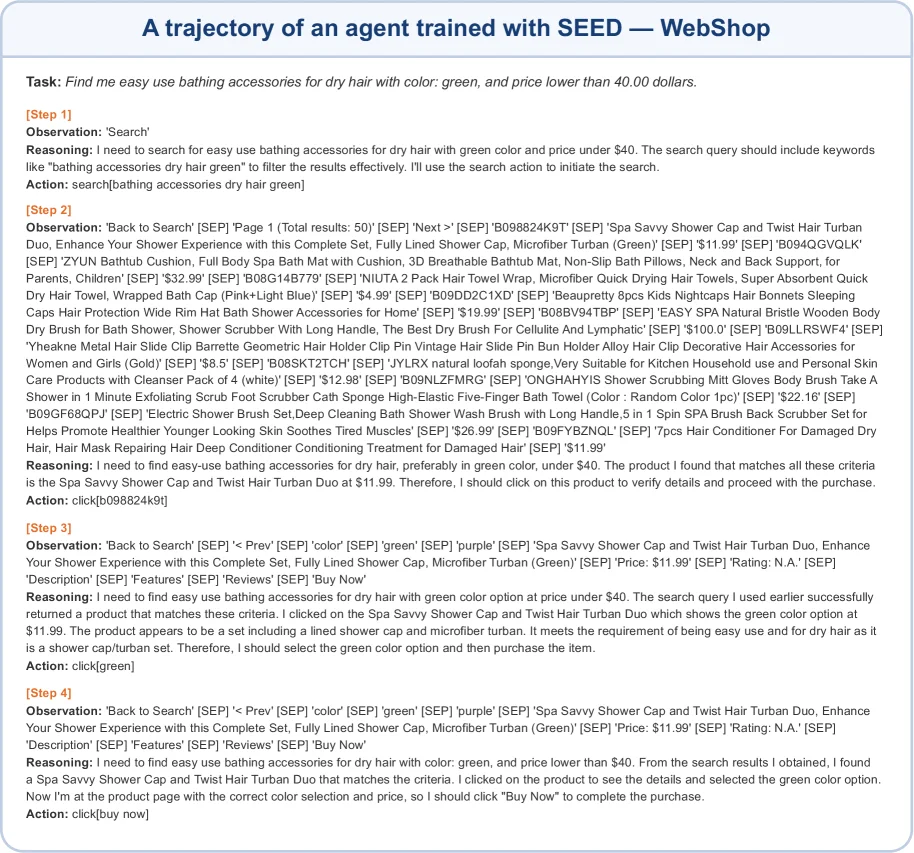
Figure 16: WebShop Example 1. Seed identifies a green shower cap and hair turban set under $40, verifies the selected variant, and completes the purchase in four steps.

This figure demonstrates the trajectory of an agent trained with SEED (SElf - Evolving On - Policy Distillation) in the WebShop environment to complete the task of "finding easy - to - use bathing accessories for dry hair with green color and a price lower than $40". It clearly shows how the agent interacts with the environment through multiple rounds (search, click, color selection, purchase) to complete the task, reflecting how the SEED method optimizes decision - making through the interaction between the strategy and environmental feedback.

First, look at the task description: At the top, the task is clearly defined as "Find me easy use bathing accessories for dry hair with color: green, and price lower than 40.00 dollars", which is the goal of the agent.

Then, there is a step - by - step breakdown. From Step 1 to Step 4, each step includes three parts: Observation (observation), Reasoning (reasoning), and Action (action). The data/information flows in the order of "observing the environmental state → reasoning based on the goal and the current state → performing an action to change the environment":

  • Step 1:
  • Observation: It shows "Search", indicating that the current environmental state is the search interface, and a search needs to be initiated.
  • Reasoning: It explains the necessity of searching, that is, keywords like "bathing accessories dry hair green" need to be included to effectively filter the results. Therefore, it is decided to perform a search action.
  • Action: Perform "search[bathing accessories dry hair green]", that is, initiate a search for the target accessories. This is the initial interaction of the task to obtain a list of related products.

  • Step 2:

  • Observation: It displays the search result page, including the names, prices, descriptions, etc. of multiple products (for example, the "Spa Savvy Shower Cap and Twist Hair Turban Duo" is priced at $11.99, which is within the budget and may be green). The total number of results is 50, and there are also pagination information (Page 1).
  • Reasoning: It analyzes the search results and finds the product that meets the requirements of "easy to use, for dry hair, green, and price < $40" (that is, the Spa Savvy Shower Cap and Twist Hair Turban Duo, priced at $11.99). Therefore, it is decided to click on this product to verify the details and promote the purchase process.
  • Action: Perform "click[b098824k9t]", that is, click on this product to enter the detail page. This is a screening and interaction of the search results, focusing on the target product.

  • Step 3:

  • Observation: It displays part of the product detail page information, including color options (green, purple, etc.), a price of $11.99, a rating of N.A., a description, and functions, etc. It is confirmed that the color option of the product includes green and the price meets the requirements.
  • Reasoning: It verifies again whether the product meets all the conditions (easy to use, for dry hair, green, and price < $40). After confirmation, it is decided to select the green color option to prepare for the purchase.
  • Action: Perform "click[green]", that is, select the green color variant. This is a selection of product attributes to ensure that the purchased product is green.

  • Step 4:

  • Observation: It displays the product detail page again, confirming that the color has been selected as green and the price is still $11.99, which meets all the conditions.
  • Reasoning: It summarizes the task completion situation, that is, the product that meets the conditions has been found and the green variant has been selected. Now, the purchase action (clicking "Buy Now") needs to be performed to complete the entire task.
  • Action: Perform "click[buy now]", that is, click the purchase button to complete the task.

This figure reveals how the SEED method works: The agent interacts with the WebShop environment through multiple rounds (search, click on the product, select color, purchase). In each step, it performs observation (environmental state), reasoning (judging the next action based on the current observation and the task goal), and then performs an action (changing the environmental state). This "observation - reasoning - action" cycle reflects the interaction between the strategy and environmental feedback in reinforcement learning. The SEED method converts the completed trajectories into "hindsight skills" (such as keyword selection for search, product screening, color selection, etc., which are reusable workflows) and distills the behavioral effects of these skills back into the strategy model. This enables the strategy to better utilize these skills in subsequent decisions, and at the same time, the update of the strategy in turn improves the ability of skill analysis, forming a self - evolving closed loop. For example, in Step 1, the agent learns how to initiate an effective search; in Step 2, it learns how to screen products that meet the conditions; in Step 3, it learns how to select the correct color variant; and finally, it completes the task in Step 4. Throughout the process, the strategy is continuously optimized through interaction with the environment, and the distillation mechanism of SEED ensures that these intermediate decisions (skills) are effectively learned and utilized, making up for the deficiency of traditional reinforcement learning in the guidance of intermediate decisions due to sparse rewards.

From the result perspective, the agent successfully completes the task within four steps: from search to product screening, color selection, and finally purchase. This verifies the effectiveness of the SEED method in long - horizon tasks (multi - round interactions, tool use, environmental feedback), that is, it can make the agent learn to complete complex interaction tasks through self - evolving strategy distillation. Each decision in each step has a clear reasoning basis, and the task goal (finding and purchasing a product that meets the conditions) is finally achieved.

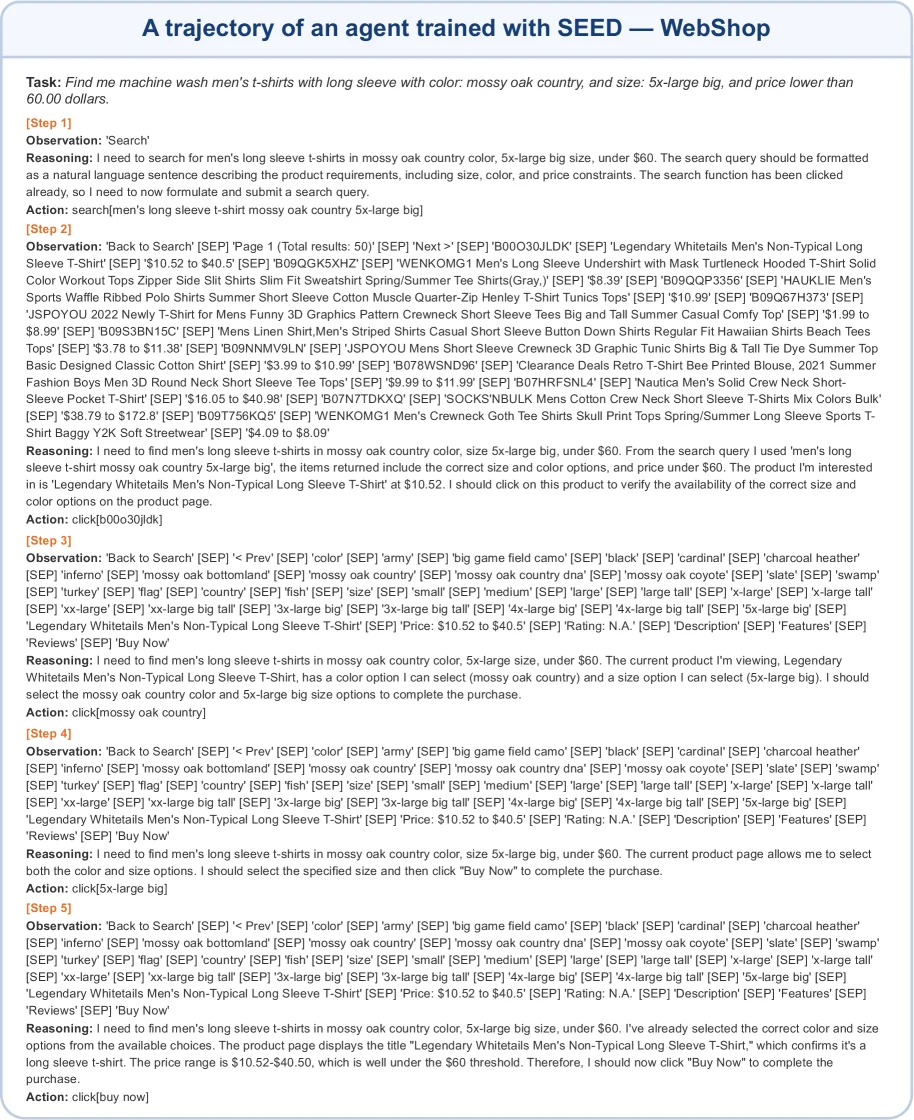
Figure 17: WebShop Example 2. Seed preserves the requested product constraints and selects mossy oak country and 5x-large big before purchasing a matching long-sleeve shirt under $60.

This diagram illustrates the complete trajectory of an agent trained using the SEED method as it completes a specific shopping task within a WebShop environment, clearly demonstrating how the agent processes the task step by step, interacts with the environment, and ultimately achieves its goal.

First, the top of the diagram specifies the task objective: find a men's long-sleeve T-shirt priced under $60, in the color "mossy oak country," and size "5x-large big." This sets a clear endpoint for the entire trajectory.

Next, the diagram shows the agent's actions and thought processes in sequential steps (Step):

  • Step 1 (Search):

    • Observation: The agent needs to search for men's long-sleeve T-shirts that meet the criteria.
    • Reasoning: The agent analyzes the task requirements and determines that the search keywords should include the color, size, and price constraints.
    • Action: The agent performs a search operation, entering the search query: "men's long sleeve t-shirt mossy oak country 5x-large big." This step marks the beginning of the task, where the agent generates an initial search command based on its understanding.
  • Step 2 (Browse Search Results):

    • Observation: The agent returns to the search page, which displays the search results (a total of 50 results) and lists several products with their prices.
    • Reasoning: The agent needs to filter the search results to find products that meet the criteria. It identifies the first product, "Legendary Whitetails Men's Non-Typical Long Sleeve T-Shirt," priced at $10.52, which fits the price requirement, and decides to click on it to view more details.
    • Action: The agent clicks on the product link (click[b00030jldk]). This step demonstrates how the agent makes decisions based on observed results and interacts with the environment.
  • Step 3 (Select Color):

    • Observation: The agent is now on the product details page, where it sees a list of color options, including "mossy oak country."
    • Reasoning: The agent needs to select the specified color, "mossy oak country," and then proceed to select the size.
    • Action: The agent clicks on the "mossy oak country" color option (click[mossy oak country]). This step shows how the agent handles the selection of specific product attributes.
  • Step 4 (Select Size):

    • Observation: The agent is on the page after selecting the color, where it sees a list of size options, including "5x-large big."
    • Reasoning: The agent needs to select the specified size, "5x-large big," and then proceed to purchase.
    • Action: The agent clicks on the "5x-large big" size option (click[5x-large big]). This step further advances the purchase process.
  • Step 5 (Confirm Purchase):

    • Observation: The agent is on the page after selecting the size, and it confirms the product information again: the color is "mossy oak country," the size is "5x-large big," and the price is between $10.52 and $40.50, which fits within the budget.
    • Reasoning: The agent confirms that all constraints have been met and that it is time to complete the purchase.
    • Action: The agent clicks the "Buy Now" button (click[buy now]). This marks the completion of the task.

This diagram reveals the specific workings of the SEED method: 1. Task Decomposition and Execution: The agent breaks down a complex long-term task (shopping) into a series of specific, executable steps (search, browse, select attributes, purchase). 2. Observe-Reason-Act Cycle: In each step, the agent first observes the current state of the environment, then reasons to determine the next action, and finally executes that action. This cycle is central to how reinforcement learning agents interact with their environment. 3. Decision-Making Using Feedback: The agent adjusts its behavior based on feedback from the environment (such as search results and product attribute options) to ensure that each step moves it closer to completing the task. 4. Implicit Learning and Application of Skills: Although the diagram does not directly show the internal mechanisms of SEED, it can be inferred that the agent, while performing these steps, may have learned "skills" for handling such tasks (e.g., how to filter products based on constraints, how to perform multi-step interactions). The SEED method enhances the agent's decision-making ability by converting these completed trajectories into "hindsight" skills and distilling them back into the policy model. The agent's behavior in this diagram is a manifestation of this optimized strategy, effectively handling multi-step, constrained interaction tasks.

In summary, this diagram, through a specific WebShop shopping example, vividly demonstrates how an agent trained with the SEED method understands the task, interacts with the environment, and ultimately successfully completes the goal. It clearly presents the agent's decision-making process and sequence of actions, proving the effectiveness of this method in handling long-term, multi-step interaction tasks.

← → flip · ↑ ↓ scroll notes · Esc exit