🌊 Tide

Information moves like the tide. We pick the waves worth studying.

中文

← Today's tide

Published 2026-07-14 · Tencent Hunyuan · Ruhan Wang, Yucheng Shi, Zongxia Li et al.

Harness Handbook: Making Evolving Agent Harnesses Readable,Navigable, and Editable

arXiv · HuggingFace · ▲199

Abstract (verbatim)

The capability of a modern AI agent depends not only on its foundation model but also on its harness, which constructs prompts, manages state, invokes tools, and coordinates execution. As models, APIs, environments, and requirements evolve, the harness must be continually modified. Before such a change can be made, a developer or coding agent must identify all code locations that implement the target behavior. This is difficult because production harnesses are large, tightly coupled, and behaviorally distributed, while modification requests describe what the system should do and repositories are organized by files and modules. Code search, repository indexing, and long-context processing ease inspection, but still leave this behavior-to-code mapping to be recovered by hand. Behavior localization is therefore a central bottleneck in harness evolution. We introduce the Harness Handbook, a behavior-centric representation synthesized automatically from a harness codebase via static analysis and LLM-assisted structuring, linking each behavior to its corresponding source. We also introduce Behavior-Guided Progressive Disclosure (BGPD), which guides agents from high-level behaviors to relevant implementation details and verifies candidate locations against the current source. On diverse modification requests from two open-source harnesses, Handbook-Assisted planning improves behavior localization and edit-plan quality while using fewer planner tokens, with the largest gains on scattered sites, rarely executed paths, and cross-module interactions. Evolving complex agentic systems thus depends not only on generating edits, but also on determining where those edits should be made.

Background

Background Analysis

1. Technical Context and Real-World Needs
Modern AI agents (e.g., tool-using assistants or automated systems) rely not only on foundational models but also on their "harness"—a control layer that coordinates prompts, state management, tool invocation, and execution across components. These systems are widely used for complex tasks like web interaction, code generation, or data manipulation. However, as models, APIs, or requirements evolve, harnesses must be continuously updated. The core challenge for developers is: how to quickly locate all relevant code implementations when modifying a feature (e.g., optimizing tool calls or fixing execution bugs)? Traditional methods, whether manual code review or agent-based search, are inefficient and error-prone in large, tightly coupled harnesses.

2. Limitations of Previous Approaches
Existing tools (e.g., code search, repository indexing, or long-context processing) simplify code navigation but fail to bridge the gap between "behavior" (e.g., "retry failed queries three times") and "implementation." Developers or agents must manually map behavioral requests to code, a process that is time-consuming and prone to oversight. For example, a simple behavior might span multiple functions or files, and agents, limited by context length, cannot analyze all code at once, leading to missed edge cases or cross-module interactions.

3. Proposed Solution
The paper introduces the "Harness Handbook," a behavior-centric representation that automatically links system behaviors to code implementations via static analysis and LLM-assisted structuring. For instance, it connects the behavior "handle user authentication" directly to the corresponding code. Additionally, "Behavior-Guided Progressive Disclosure (BGPD)" guides agents from high-level behaviors to implementation details step-by-step, verifying candidate code against the current version. This approach makes the "behavior→code" mapping explicit, reducing the cognitive load for both humans and agents.

4. Key Differences from Prior Work
Previous methods focused on improving codebase explorability (e.g., generating summaries or indexes) but did not address the direct association between behaviors and code. The paper’s breakthrough lies in:
- Focus Shift: From "how to organize code" to "how to organize behavior," enabling developers/agents to first understand the required system behavior before locating implementations.
- Automation: Behavior-code mappings are generated automatically via static analysis and LLMs, rather than manual annotation or static rules.
- Dynamic Validation: BGPD verifies code-behavior alignment during planning, avoiding outdated or incorrect suggestions.

Experiments show this approach significantly improves localization accuracy and edit-plan quality, especially for scattered logic or cross-module interactions.
Method, Figure by Figure

M E T H O D1 / 5

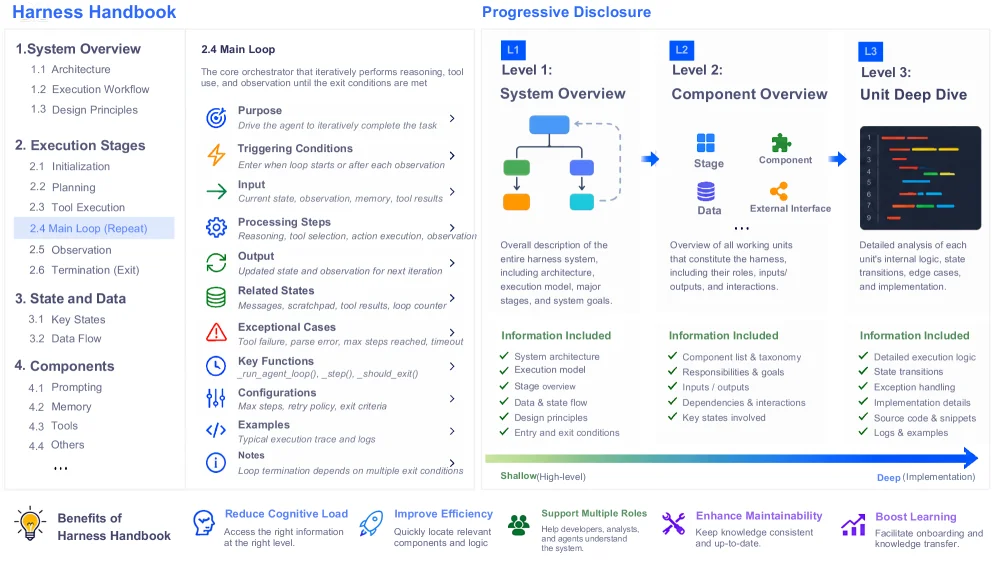
Figure 1 : Overview of the Harness Handbook representation. Its three-level hierarchy progresses from a system-level overview to stage-level component overviews and source-backed unit details. The navigation pane provides component and state indexes for direct access and cross-stage tracing.

This diagram illustrates the core design of the Harness Handbook, which is a behavior-centric representation system. It organizes information through a three-level hierarchical structure (from system-level overview to stage-level component overview, and then to unit details supported by source code) and combines the "Behavior-Guided Progressive Disclosure (BGPD)" mechanism to help developers quickly locate specific code implementations from high-level behaviors. The following is a detailed analysis of each component in the diagram:

Left Side: Navigation and Content Panel (Behavior-Centric Knowledge Organization)

  • Chapter Structure: The left side is divided into multiple chapters (such as System Overview, Execution Stages, State and Data, Components, etc.), and each chapter has sub-items (such as 2.4 Main Loop). These are ways to classify and organize behaviors, breaking down the system's behavioral logic into dimensions such as "system architecture → execution stages → state data → components".
  • 2.4 Main Loop (Core Loop): This is the core execution logic of the system, including:
  • Purpose: Drives the agent to iteratively complete tasks (clarifies the behavioral goal).
  • Triggering Conditions: The conditions for starting the loop or after each observation (when to execute).
  • Input: Current state, observation, memory, tool results (input required for execution).
  • Processing Steps: Tool selection, action execution, observation (specific steps of execution).
  • Output: Updated state and observation (for the next iteration).
  • Related States: Related messages, staging area, tool results, loop counter (associated state data).
  • Exceptional Cases: Tool failure, parameter error, maximum steps, timeout (exception handling logic).
  • Key Functions: Such as _run_agent_loop(), _step(), _should_exit() (abstraction of core functions).
  • Configurations: Maximum steps, retry strategy, exit conditions (configuration parameters).
  • Examples: Typical execution traces and logs (examples of actual runs).
  • Notes: The loop termination depends on multiple exit conditions (supplementary explanation). This part is the detailed definition of behavior, structuring information such as "what to do", "how to do it", "when to do it", and "exception handling", providing a logical basis for the subsequent code mapping.

Middle: Three-Level Hierarchy of BGPD (Information Flow and Disclosure Mechanism)

The diagram shows the information flow from high-level to low-level and the "progressive disclosure" process through Level 1, Level 2, and Level 3: - Level 1: System Overview: - Content: The overall description of the system, including architecture, execution model, main stages, system goals (Information Included column). - Role: Provides high-level behavioral context, allowing developers to quickly understand the overall goals and structure of the system ("shallow, high-level" information). - Visualization: Uses flowcharts to show the relationships between the system's stages (Stage), data (Data), components (Component), and external interfaces (External Interface). - Level 2: Component Overview: - Content: Overview of all work units, including their roles, inputs/outputs, and interactions (Information Included column). - Role: Goes from system-level to component-level, showing the behavior and interactions of each component (more specific than Level 1, but still not involving code details). - Visualization: Uses icons (Stage, Component, Data, External Interface) to show the types and relationships of components. - Level 3: Unit Deep Dive: - Content: Detailed analysis of each unit, including execution logic, state transitions, edge cases, implementation details (Information Included column). - Role: Provides code-level details, verifying whether the candidate code location matches the current source code ("deep, implementation-level" information). - Visualization: Uses code snippets (such as colored line numbers) to show specific code implementations.

Information Flow and Disclosure Mechanism

  • Flow Direction: From Level 1 (system overview) → Level 2 (component overview) → Level 3 (unit details), the information goes from "shallow" to "deep", from "abstract" to "specific".
  • Progressive Disclosure: Developers can start from high-level behaviors (such as system goals) and gradually go deep into component behaviors and finally to code implementations. This mechanism reduces cognitive load because developers do not need to deal with a large amount of code details at the beginning, but rather disclose relevant information on demand.
  • Navigation and Cross-Tracking: The navigation panel on the left (such as the index of Components, State and Data) supports direct access to specific components or states, as well as cross-stage tracking of the evolution of behaviors in different stages.

Core Logic of the Method (How It Works)

The core of the Harness Handbook is behavior-centric representation: 1. Automatic Synthesis: Automatically extracts behavioral information (such as execution stages, state data, component logic, etc.) from the harness codebase through static analysis and LLM-assisted structuring. 2. Behavior-Code Mapping: Links each behavior (such as the execution logic of "Main Loop") to the corresponding source code location, solving the problem of "behavior to code" mapping. 3. Progressive Disclosure (BGPD): Guides developers from high-level behaviors (Level 1) to component behaviors (Level 2), and then to code details (Level 3), and verifies whether the candidate code location matches the current source code at each step. 4. Navigation Support: Quickly locates related components and states through the index on the left and cross-tracking, reducing the workload of manual search.

Conclusion (Inferences from the Diagram)

This diagram shows how the Harness Handbook closely links "behavior" and "code" through a three-level hierarchical structure and progressive disclosure mechanism: - Developers can efficiently locate the code implementation of the target behavior (solving the bottleneck of "behavior localization"). - Information is disclosed in the order of "shallow → deep", reducing cognitive load and improving efficiency. - Supports multiple roles (developers, analysts, agents), maintaining knowledge consistency and currency. - Enhances maintainability (clear correspondence between code and behavior) and learning ability (newcomers can quickly understand the system).

In short, the Harness Handbook solves the problem of difficult "behavior to code" mapping in traditional harness evolution through behavior-centric representation and progressive disclosure mechanism, making the modification and evolution of harness more efficient and accurate.

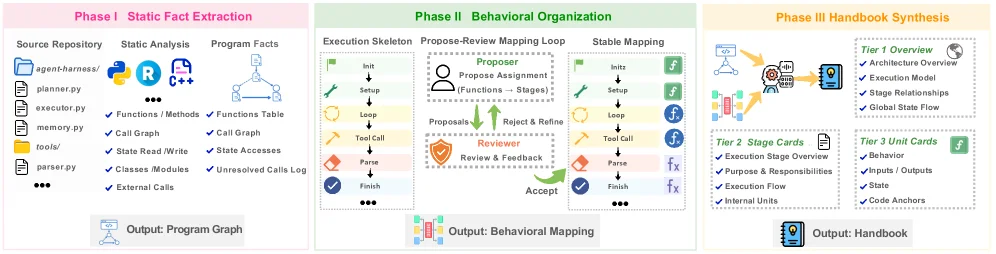
Figure 2 : Construction pipeline for Harness Handbook. Static analysis extracts source-linked facts, behavioral organization maps source units to execution stages, and hierarchical synthesis builds the L1–L3 handbook.

This diagram illustrates the construction process of the "Harness Handbook," divided into three main phases, clearly presenting the automated generation process from the code repository to the final handbook:

Phase I: Static Fact Extraction

  • Components and Data Flow:
  • The "Source Repository" on the left lists files in the codebase (such as agent-harness/, planner.py, executor.py, etc.), which serve as the input for analysis.
  • The "Static Analysis" section in the middle uses tools (like Python icons, R icons, code analysis icons) to perform static analysis on the source code and extract "Program Facts."
  • "Program Facts" include two types of information:
    • Functions/methods, call graphs, state reads/writes, class modules, external modules, etc. (marked with a checkmark);
    • Function tables, call graphs, state access, unresolved call logs, etc. (marked with a checkmark or ellipsis).
  • The final output is the "Program Graph," a structured representation associated with the source code that captures the basic facts of the code.

Phase II: Behavioral Organization

  • Components and Data Flow:
  • This phase is divided into three sub-modules: "Execution Skeleton," "Propose-Review Mapping Loop," and "Stable Mapping."
  • Execution Skeleton: Starts from "Init," goes through "Setup," "Loop" (including steps like "Tool Call," "Parse"), and finally reaches "Finish." This skeleton describes the structural flow of code execution.
  • Propose-Review Mapping Loop: An iterative process that includes a "Proposer" (proposing function-to-stage assignments), "Proposal Assignment (Functions → Stages)," "Reject & Refine" (rejecting and refining proposals), "Reviewer" (reviewing and providing feedback), "Accept" (accepting), etc. This loop is used to map source code units (like functions) to execution stages (like tool calls, parsing, etc.).
  • Stable Mapping: Similar to the "Execution Skeleton," but after the propose-review loop, it outputs a more stable "Behavioral Mapping," which is the mapping relationship between behavior and code.
  • The final output is the "Behavioral Mapping," which associates the behavior of the code (like execution stages) with the corresponding source code units.

Phase III: Handbook Synthesis

  • Components and Data Flow:
  • This phase synthesizes the "Behavioral Mapping" into a hierarchical "Handbook," divided into three tiers:
    • Tier 1 Overview: Contains high-level information such as architecture overview, execution model, stage relationships, global state flow, etc.
    • Tier 2 Stage Cards: Each stage card includes detailed information such as execution stage overview, behavior, purpose and responsibility, input/output, state, execution flow, internal units, etc.
    • Tier 3 Unit Cards: Each unit card includes the most detailed implementation information such as behavior, input/output, state, code anchors, etc.
  • The output is the "Handbook," a hierarchical, behavior-centered representation that links each behavior to its corresponding source code.

How the Method Works

  1. Static Fact Extraction: Extracts facts associated with the source code (like functions, call graphs, state access, etc.) by statically analyzing the codebase, generating a program graph.
  2. Behavioral Organization: Uses an execution skeleton to describe the flow of code execution, then maps source code units to execution stages through a propose-review loop, generating a stable behavioral mapping.
  3. Handbook Synthesis: Synthesizes the behavioral mapping into a hierarchical handbook, from high-level overviews to detailed unit cards, making the correspondence between behavior and code clearly visible.

Results and Conclusion

This diagram shows the automated construction process from the code repository to the behavioral handbook, solving the bottleneck problem of behavior localization through static analysis and LLM-assisted structuring. This method associates behavior with code, making it easier for developers or coding agents to identify the code locations for implementing target behaviors when modifying the harness.

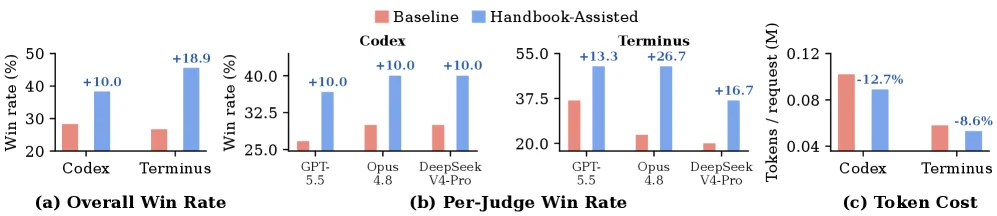
Figure 3 : Plan quality and planner token usage on Codex and Terminus-2. (a) Overall win rates aggregated across the three judges. (b) Win rates reported separately by GPT-5.5, Opus 4.8, and DeepSeek-V4-Pro. (c) Average number of planner tokens per request; lower values indicate greater efficiency.

This figure (Figure 3) presents a comparative analysis of "Plan quality" and "planner token usage" for two AI agent harnesses (Codex and Terminus - 2), comparing the "Handbook - Assisted" method with the "Baseline" method. We analyze each sub - figure in detail:

Sub - figure (a): Overall Win Rate

  • Axes and Components: The horizontal axis represents two different harnesses: Codex and Terminus. The vertical axis represents the win rate (in percentage). Red bars stand for the "Baseline" method's win rate, while blue bars represent the "Handbook - Assisted" method's win rate. The numbers above the blue bars (e.g., +10.0 for Codex, +18.9 for Terminus) indicate the percentage improvement of the Handbook - Assisted method's win rate over the Baseline.
  • Data Flow and Interpretation: For Codex, the Baseline win rate is around 28%, and the Handbook - Assisted win rate is about 38%, with a 10.0% improvement. For Terminus, the Baseline win rate is approximately 26%, and the Handbook - Assisted win rate is around 45%, with an 18.9% improvement. This shows that the Handbook - Assisted method has a higher overall win rate than the Baseline method.

Sub - figure (b): Per - Judge Win Rate

  • Axes and Components: The horizontal axis represents three different judge models: GPT - 5.5, Opus 4.8, and DeepSeek V4 - Pro. The vertical axis is also the win rate (in percentage). For each judge model, there are red (Baseline) and blue (Handbook - Assisted) bars. The numbers above the blue bars (e.g., +10.0 for GPT - 5.5, +10.0 for Opus 4.8, +10.0 for DeepSeek V4 - Pro) represent the percentage improvement of the Handbook - Assisted method's win rate over the Baseline for each judge.
  • Data Flow and Interpretation: For GPT - 5.5, the Baseline win rate is about 25%, and the Handbook - Assisted win rate is around 35% (with a 10.0% improvement). For Opus 4.8, the Baseline win rate is approximately 27%, and the Handbook - Assisted win rate is about 37% (with a 10.0% improvement). For DeepSeek V4 - Pro, the Baseline win rate is around 27%, and the Handbook - Assisted win rate is about 37% (with a 10.0% improvement). This indicates that across different judge models, the Handbook - Assisted method outperforms the Baseline method in terms of win rate, with a relatively consistent improvement magnitude.

Sub - figure (c): Token Cost

  • Axes and Components: The horizontal axis represents the two harnesses: Codex and Terminus. The vertical axis represents the average number of planner tokens per request (in millions, M). Red bars represent the Baseline method's token count, and blue bars represent the Handbook - Assisted method's token count. The percentages above the blue bars (e.g., - 12.7% for Codex, - 8.6% for Terminus) indicate the percentage reduction of the Handbook - Assisted method's token count compared to the Baseline (a higher reduction means greater efficiency).
  • Data Flow and Interpretation: For Codex, the Baseline token count is around 0.11M, and the Handbook - Assisted token count is about 0.096M, with a 12.7% reduction. For Terminus, the Baseline token count is approximately 0.06M, and the Handbook - Assisted token count is around 0.055M, with an 8.6% reduction. This shows that the Handbook - Assisted method is more efficient in terms of token usage for the planner, as it can complete the same planning task with fewer tokens.

How the Method Works (from the Figure)

The paper introduces the "Harness Handbook" (a behavior - centered representation synthesized automatically from a harness codebase via static analysis and LLM - assisted structuring) and "Behavior - Guided Progressive Disclosure (BGPD)" (which guides agents from high - level behaviors to relevant implementation details and verifies candidate locations against the current source). The results in this figure show that the "Handbook - Assisted" planning method (combining Harness Handbook and BGPD) is better than the Baseline method in both plan quality (win rate) and efficiency (token usage). Specifically, in terms of overall win rate and per - judge win rate, the Handbook - Assisted method has a higher win rate, indicating that it can generate better plans. In terms of token cost, the Handbook - Assisted method uses fewer tokens, indicating that its planning process is more efficient.

Conclusions from the Figure

  • The "Handbook - Assisted" method outperforms the "Baseline" method in overall win rate, per - judge win rate, and token cost efficiency.
  • For the overall win rate, the improvement is more significant for Terminus (18.9%) than for Codex (10.0%).
  • For the per - judge win rate, the improvement is relatively consistent (around 10.0%) across different judge models (GPT - 5.5, Opus 4.8, DeepSeek V4 - Pro).
  • For token cost, the reduction is more significant for Codex (12.7%) than for Terminus (8.6%), but both show efficiency improvements.
  • These results validate the effectiveness of the "Harness Handbook" and "BGPD" methods proposed in the paper.

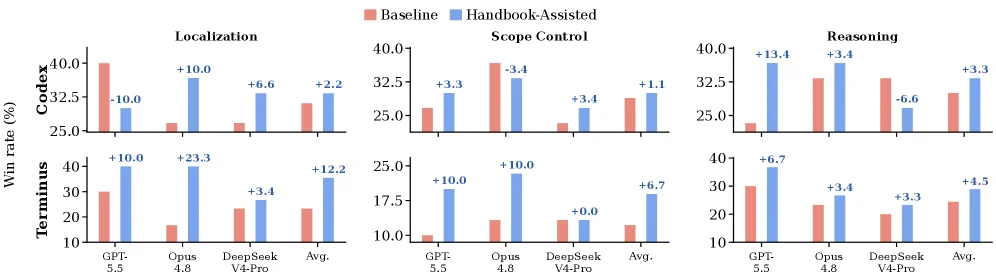
Figure 4 : Per-judge win rates for three evaluation dimensions. Rows show results for Codex and Terminus-2, while columns show Localization, Scope Control, and Reasoning.

This figure (Figure 4) presents per-judge win rates for three evaluation dimensions: Localization, Scope Control, and Reasoning. The rows correspond to two models: Codex (top row) and Terminus-2 (bottom row), while the columns represent the three evaluation dimensions.

Each subplot (i.e., each model-dimension combination) displays data in a bar chart format. The x-axis represents different evaluation targets or model variants, such as GPT-5.5, Opus 4.8, DeepSeek V4-Pro, and an average (Avg.). The y-axis indicates the win rate percentage (Win rate (%)).

For each evaluation target, there are two bars: - The red bar represents the win rate of the "Baseline" method. - The blue bar represents the win rate of the "Handbook-Assisted" method.

In some blue bars, specific values are labeled, indicating the improvement in win rate of the "Handbook-Assisted" method over the "Baseline" method. For example, in the "Localization" dimension for the Terminus-2 model, the blue bar for GPT-5.5 is labeled "+10.0," meaning the "Handbook-Assisted" method has a 10.0 percentage point higher win rate than the "Baseline" method.

From the figure, we can observe: 1. In most cases, the "Handbook-Assisted" method has a higher win rate than the "Baseline" method, indicating its effectiveness in improving behavior localization, scope control, and reasoning capabilities. 2. Different evaluation targets show varying performance across the dimensions. For instance, in the "Localization" dimension for the Codex model, DeepSeek V4-Pro shows a significant improvement with the "Handbook-Assisted" method (+6.6%), while in the "Reasoning" dimension for the Terminus-2 model, GPT-5.5 has the largest improvement with the "Handbook-Assisted" method (+13.4%). 3. The averages (Avg.) show the overall trend, with the "Handbook-Assisted" method having a higher average win rate than the "Baseline" method across all three dimensions, further demonstrating the method's effectiveness.

This figure reveals how the "Handbook-Assisted" method outperforms the baseline method across three key dimensions. Through specific win rate data and improvement values, it intuitively demonstrates the method's advantages in enhancing AI agent behavior localization and edit plan quality. By comparing the performance of different models and evaluation targets, the applicability and effectiveness of the method in various scenarios can be clearly seen.

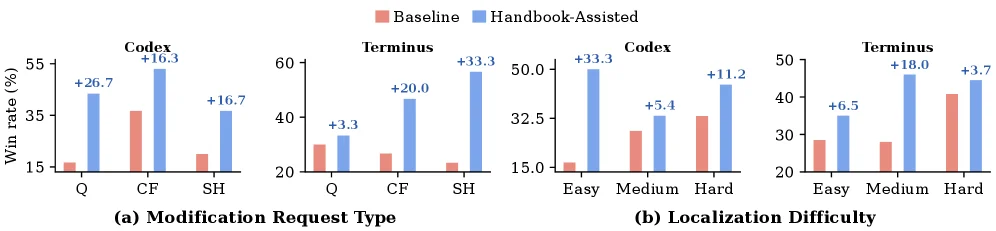
Figure 5 : Win rates by (a) modification request type and (b) localization difficulty. Q, CF, and SH denote Query, Cross-file, and Search-Hostile requests.

This figure (Figure 5) presents a comparison of the "win rate" between the "Handbook - Assisted" method and the "Baseline" method across different dimensions to verify the effectiveness of the method. We will explain in detail through two sub - figures (a) and (b):

Sub - figure (a): Win rate by modification request type

  • X - axis: It is divided into three groups, corresponding to three types of modification requests, namely Q (Query, query - type request), CF (Cross - file, cross - file - type request), and SH (Search - Hostile, search - unfriendly - type request). Within each group, there are win rate data of two methods: "Baseline" (red bar) and "Handbook - Assisted" (blue bar). At the same time, the number above the blue bar represents the improvement range relative to the baseline (for example, + 16.3 under the CF type means that the win rate of the handbook - assisted method is 16.3% higher than that of the baseline method).
  • Y - axis: It represents the win rate, with the unit of percentage (%), and the range is from about 0 to 55 (the range is slightly different for different sub - figures).
  • Data and conclusion:
    • For Q - type requests, the win rate of the baseline method is about 15%, and that of the handbook - assisted method is about 41.7% (15%+26.7%), with an improvement of 26.7%.
    • For CF - type requests, the win rate of the baseline method is about 35%, and that of the handbook - assisted method is about 51.3% (35% + 16.3%), with an improvement of 16.3%.
    • For SH - type requests, the win rate of the baseline method is about 15%, and that of the handbook - assisted method is about 31.7% (15%+16.7%), with an improvement of 16.7%.
    • Overall, under different types of modification requests, the win rate of the handbook - assisted method is significantly higher than that of the baseline method, and the improvement range is relatively large under the CF type (+16.3). This indicates that the handbook - assisted method can more effectively complete tasks such as behavior positioning or edit planning when dealing with different types of modification requests (combined with the background of the paper, the "win" here should mean better performance in terms of behavior positioning, edit plan quality, or planner token usage, etc.).

Sub - figure (b): Win rate by localization difficulty

  • X - axis: It is divided into two groups, corresponding to two different harnesses (Codex and Terminus). Within each group, it is further divided into three levels of localization difficulty: Easy (simple), Medium (medium), and Hard (difficult) according to the localization difficulty. Similarly, there are win rate data of the baseline (red bar) and the handbook - assisted (blue bar) at each level, and the number above the blue bar is the improvement range relative to the baseline.
  • Y - axis: It represents the win rate, with the unit of percentage (%). The range of the Codex group is from about 0 to 50, and the range of the Terminus group is from about 0 to 50 (slightly different).
  • Data and conclusion:
    • For the Easy difficulty of Codex: The win rate of the baseline is about 15%, and that of the handbook - assisted method is about 48.3% (15%+33.3%), with an improvement of 33.3%.
    • For the Medium difficulty of Codex: The win rate of the baseline is about 30%, and that of the handbook - assisted method is about 35.4% (30% + 5.4%), with an improvement of 5.4%.
    • For the Hard difficulty of Codex: The win rate of the baseline is about 30%, and that of the handbook - assisted method is about 41.2% (30%+11.2%), with an improvement of 11.2%.
    • For the Easy difficulty of Terminus: The win rate of the baseline is about 25%, and that of the handbook - assisted method is about 31.5% (25%+6.5%), with an improvement of 6.5%.
    • For the Medium difficulty of Terminus: The win rate of the baseline is about 25%, and that of the handbook - assisted method is about 43% (25%+18.0%), with an improvement of 18.0%.
    • For the Hard difficulty of Terminus: The win rate of the baseline is about 40%, and that of the handbook - assisted method is about 43.7% (40%+3.7%), with an improvement of 3.7%.
    • From the overall trend, in Codex, the improvement range of the simple difficulty is the largest (+33.3), while in Terminus, the improvement range of the medium difficulty is the largest (+18.0). This shows that the handbook - assisted method can bring an increase in the win rate when dealing with behavior positioning tasks of different difficulty levels, especially the improvement is more significant in simple and medium - difficulty tasks. This also verifies the effectiveness of the method in solving the bottleneck problem of behavior positioning (because behavior positioning is the core bottleneck of harness evolution, and the method can improve the win rate, which means it can better solve this bottleneck).

Understanding of the method operation (combined with the paper background)

The core of the paper is to solve the behavior positioning bottleneck problem in harness evolution. The proposed methods include "Handbook - Assisted" and "Behavior - Guided Progressive Disclosure (BGPD)". This figure shows the effectiveness of the method by comparing the win rates of the baseline and the handbook - assisted method under different types of modification requests and localization difficulties. Specifically, the "Handbook - Assisted" method automatically synthesizes behavior - centered representations (obtained from the harness code library through static analysis and LLM - assisted structuring), links each behavior to its corresponding source code, and then guides the agent from high - level behaviors to related implementation details through BGPD and verifies whether the candidate position matches the current source code. From the data in the figure, it can be seen that whether under different types of modification requests (query, cross - file, search - unfriendly) or different localization difficulties (simple, medium, difficult), the win rate of the handbook - assisted method is higher than that of the baseline method. This shows that the method can more effectively perform behavior positioning and edit planning, thus solving the core bottleneck problem of behavior positioning. For example, the improvement range is relatively large in cross - file (CF) and simple - difficulty tasks, which shows that the method has a more obvious effect when dealing with these more challenging tasks.

Summary of coordinates and comparison objects

  • Coordinates: The X - axis is different categories (types of modification requests or localization difficulties), and the Y - axis is the win rate (%).
  • Comparison objects: The "Baseline" (red) and "Handbook - Assisted" (blue) methods under each category.
  • Conclusion: The win rate of the handbook - assisted method is significantly higher than that of the baseline method under all the shown categories (types of modification requests: Q, CF, SH; localization difficulties: Easy, Medium, Hard), and the improvement range is relatively large under some categories (such as CF, Easy, Medium). This verifies the effectiveness of the proposed method in solving the behavior positioning bottleneck problem in harness evolution.
← → flip · ↑ ↓ scroll notes · Esc exit