🌊 Tide

Information moves like the tide. We pick the waves worth studying.

中文

← Today's tide

Published 2026-07-14 · TIGER-Lab · Yubo Wang, Jiarong Liang, Yuxuan Zhang et al.

Function-Aware Fill-in-the-Middle as Mid-Training for Coding Agent Foundation Models

arXiv · HuggingFace · ▲104

Abstract (verbatim)

Coding agents must integrate external tool returns into ongoing reasoning - a capability that standard left-to-right pretraining on code exposes only in its forward direction. We observe that the action-observation-continuation loop of a coding agent is structurally isomorphic to a function call site, where a caller binds arguments, a callee returns a value computed elsewhere, and downstream code consumes that value. This conditioning structure exists at internet scale in ordinary code. We exploit it through function-aware fill-in-the-middle (FIM) mid-training: a self-supervised objective that masks functions selected via program dependency graph analysis and a complexity-inferability double criterion. We mid-train Qwen2.5-Coder-Instruct (7B/14B) and Qwen3-8B on a 2.6B-token decontaminated corpus drawn from 968 GitHub repositories, then apply existing agentic post-training pipelines. Mid-training improves SWE-Bench-Verified by +2.8/+3.0 at 7B/14B and by +3.2 on Qwen3-8B; SWE-Bench-Lite gains are +3.7/+4.0/+5.4 on the same models. The improvement holds across two post-training pipelines (R2E-Gym, SWE-Smith) and on a non-Qwen2.5 base (Qwen3-8B with SWE-Lego). Beyond in-domain gains, mid-training also mitigates the capability erosion that agentic post-training otherwise inflicts on non-agent coding (e.g., LiveCodeBench) and non-coding tool-use benchmarks (tau-bench, BFCL): although the mid-training corpus contains Python code only, the function-call inductive bias survives post-training and yields consistent gains.

Background

Background Analysis

1. Technical Context
Coding agents (e.g., AI tools for software engineering) have transitioned from research demos to real-world deployment (e.g., fixing bugs or automating development). A core challenge for these systems is integrating external tool outputs (e.g., API responses) into subsequent reasoning. For example, after querying a code repository, the agent must generate code based on that result. However, current methods rely heavily on "post-training" with synthetic trajectories (simulating human problem-solving), while base models (e.g., Qwen) are not optimized for this "conditional structure" (history-action-observation-continuation loop) during initial pretraining.

2. Previous Limitations
Traditional pretraining uses left-to-right token prediction or random span filling (FIM) but suffers from three flaws:
- Arbitrary Boundaries: Randomly masked code snippets often truncate expressions or statements, failing to capture function-level dependencies (e.g., a function call might involve multiple files).
- Lack of Reasoning Supervision: Models fill masks directly without intermediate reasoning (e.g., "think-then-act" logic), mismatching how agents operate.
- Diluted Signals: Random FIM, as part of pretraining, gets overwhelmed by unrelated data, making its structural knowledge ineffective for downstream tasks.

3. Proposed Solution
The paper introduces "function-aware fill-in-the-middle (FIM) mid-training":
- Target Alignment: Treats function calls as analogues to an agent’s "action-observation-continuation" loop (e.g., function arguments = action, return values = observation, downstream code = continuation).
- Precise Masking: Selects function-level targets via program dependency graph analysis, combined with a "complexity-inferability" criterion (ensuring masks are neither too simple nor incomprehensible).
- Embedded Reasoning: Inserts chain-of-thought (CoT) rationales into masked spans, training models to "reason before generating code."
- Timing Focus: Applies this stage between pretraining and post-training to preserve structured knowledge for agent tasks.

4. Key Differences
Compared to prior work, this approach:
- Maps Functions to Agents: Uses function calls (ubiquitous in code) as training targets, directly aligning with agent needs.
- Dual Criteria for Selection: Chooses masks via program analysis and complexity checks, avoiding randomness.
- Preserves Reasoning: Embeds CoT into masks, teaching "think-then-act" logic rather than direct code generation.
- Cross-Task Validation: Demonstrates gains not only in coding tasks (e.g., SWE-Bench) but also in non-coding tasks (e.g., LiveCodeBench), proving generalization.

This method improves agent performance and robustness by leveraging existing structural patterns in code without extra data.
Method, Figure by Figure

M E T H O D1 / 7

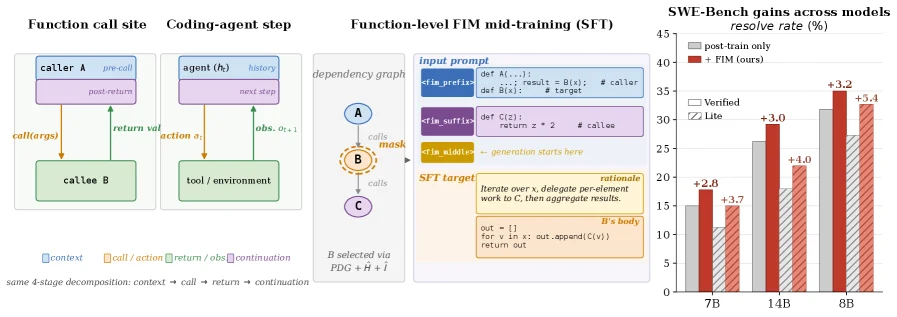
Figure 1: Left: A function call site and a single step of a coding agent are structurally similar , decomposing into the same four stages: context, call/action, return/observation, continuation. Middle: We exploit this analogy via function-aware FIM mid-training. A function B B is selected from the program dependency graph using complexity ( H ^ \hat{H} ) and inferability ( I ^ \hat{I} ) scores; the model is then mid-trained to fill in B B ’s body together with a CoT rationale, given the surrounding file as an FIM-formatted prompt. Right: Mid-training yields consistent gains across both Qwen2.5-Coder-Instruct (7B, 14B) and Qwen3 (8B) on SWE-Bench-Verified (solid bars) and SWE-Bench-Lite (hatched bars).

This figure is divided into three main sections, from left to right, illustrating the structural similarity between a function call site and a coding agent’s step, the function - aware Fill - in - the - Middle (FIM) mid - training process, and the performance gains on SWE - Bench. We analyze each part in detail:

Left: Structural Similarity between Function Call Site and Coding Agent Step

  • Far - left (Function call site): It shows the workflow of a function call. caller A (the caller) performs the pre - call operation, then initiates call(args) (the call with arguments) to call callee B (the callee). After callee B executes, it returns return val, and caller A processes this return value in the post - return stage. The entire process is decomposed into four stages: context (context, blue), call/action (call/action, orange), return/obs (return/observation, purple), and continuation (continuation, light blue), that is, the four - stage decomposition of “context→call→return→continuation”.
  • Middle - left (Coding - agent step): It shows a step of a coding agent (agent). agent (h_t) (the agent, with the current state as \(h_t\)) has a history, then performs the next step (the next action, orange arrow) and interacts with the tool/environment (tool/environment), obtaining obs, r_t, i (observation, reward, information, purple arrow), and then enters the continuation (continuation, light blue). This is completely corresponding to the four - stage structure of a function call: context (the agent's history and current state), call/action (the agent's action), return/obs (the observation returned by the tool, etc.), and continuation (subsequent processing).
  • Arrows and Colors: The orange arrows represent “call/action” (call or action), the purple arrows represent “return/obs” (return or observation), blue represents “context” (context), and light blue represents “continuation” (continuation). This shows that the structure of a function call is isomorphic to the “action - observation - continuation” loop of a coding agent.

Middle: Function - level FIM Mid - Training

This part shows how to conduct training by leveraging the above - mentioned structure: - Dependency Graph: There is a node A (the caller) in the graph, which points to B (the callee, masked, that is, the part that needs to be filled) through the calls (call) relationship. B also calls C (another function). B is selected through program dependency graph (PDG) analysis combined with the complexity (\(\hat{H}\)) and inferability (\(\hat{I}\)) double - criterion (that is, “B selected via PDG + \(\hat{H}\) + \(\hat{I}\)”). - Input Prompt: The prompt is divided into several parts: - <file_prefix>: It contains the code of the caller. For example, def A(...):\n results = B(...) (here, B is the called function and needs to be filled). - <func_suffix>: It contains the function signature of the callee B (but the body is masked). For example, def B(...):\n ... (... is the part that needs to be filled), and there is also other related code (such as def C(...): z = x + 2 # callee). - <func_midline>: It marks “generation starts here” (generation starts from here). Below it is the area where the body of B needs to be filled. Next to it is the “rationale” (reasoning) part, which requires the model to “Iterate over x, delegate persistent work to C, then aggregate results.” (Iterate over x, delegate persistent work to C, and then aggregate the results), as well as the initial structure of the body of B (such as out = []\nfor x in ...\n out.append(C(x))\nreturn out). - Training Objective (SFT Target): The model needs to fill the body of the masked function B and the corresponding Chain - of - Thought (CoT) reasoning according to the surrounding file (as an FIM - formatted prompt). This is “function - aware FIM mid - training”: by using the structure of function calls, the model learns to fill the function body, simulating the process of “calling a tool (function) and processing the return” in a coding agent.

Right: Performance Gains on SWE - Bench

This is a bar chart showing the solution rate (resolve rate, %) of different models on two tasks (Verified and Lite) of SWE - Bench: - X - axis (Models): 7B (Qwen2.5 - Coder - Instruct 7B), 14B (Qwen2.5 - Coder - Instruct 14B), 8B (Qwen3 - 8B). - Y - axis (Solution Rate, %): The range is from 0 to 45. - Bar Chart Types: - Gray solid bars: post - train - only (only post - trained, that is, the model without FIM mid - training). - Red striped bars: + FIM (ours) (the model with our FIM mid - training). - Result Comparison: - SWE - Bench - Verified (Solid Bars): - 7B: The post - train - only model has a solution rate of about 15%, and the model with FIM mid - training has a solution rate of about 17.8% (improvement of + 2.8). - 14B: The post - train - only model has a solution rate of about 28%, and the model with FIM mid - training has a solution rate of about 31% (improvement of + 3.0). - 8B: The post - train - only model has a solution rate of about 32%, and the model with FIM mid - training has a solution rate of about 35.2%? No, looking at the numerical labels: the red bar of 8B is about 3.2% higher than the gray bar. - SWE - Bench - Lite (Striped Bars): - 7B: The post - train - only model has a solution rate of about 21.3%? No, the gray bar (post - train - only) of 7B has a solution rate of about 21.3%? The red bar (with FIM) has a solution rate of about 25 (improvement of + 3.7). - 14B: The post - train - only model has a solution rate of about 26? The red bar has a solution rate of about 30 (improvement of + 4.0). - 8B: The post - train - only model has a solution rate of about 29? The red bar has a solution rate of about 34.4 (improvement of + 5.4). - Conclusion: FIM mid - training brings consistent performance improvements on both tasks (Verified and Lite) for all tested models (Qwen2.5 - Coder - Instruct 7B/14B, Qwen3 - 8B). For example, the improvements on SWE - Bench - Verified are + 2.8 for 7B, + 3.0 for 14B, and + 3.2 for 8B; the improvements on SWE - Bench - Lite are + 3.7 for 7B, + 4.0 for 14B, and + 5.4 for 8B. This shows that using the structure of function calls for mid - training can effectively improve the performance of coding agents on real - world code tasks (such as SWE - Bench).

In summary, this figure clearly shows the core idea of the method through three parts: the structural isomorphism between function calls and coding agent stepsdesigning the FIM mid - training method by using this isomorphismperformance improvement brought by mid - training. The core of the method is to use the program dependency graph to select key functions, let the model learn to fill the function body through the FIM - formatted prompt, so as to simulate the process of “calling a tool and processing the return” in a coding agent, and ultimately improve the model's performance on real - world code tasks.

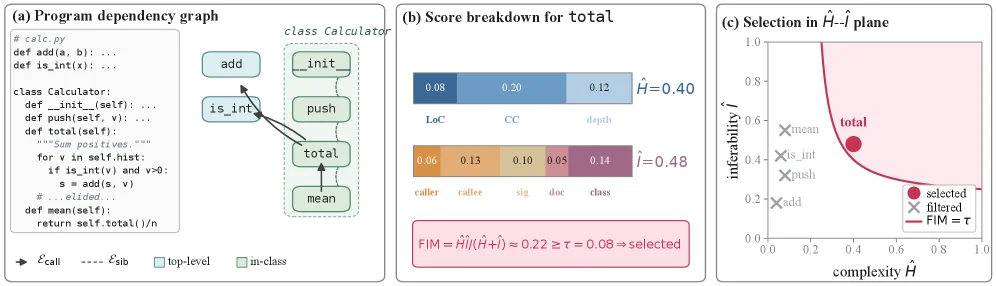
Figure 2: Function-aware FIM target selection on a small calculator example. (a) Program dependency graph parsed from the AST: solid arrows are call edges ℰ call \mathcal{E}_{\mathrm{call}} , dashed lines are sibling edges ℰ sib \mathcal{E}_{\mathrm{sib}} between same-class methods. (b) Stacked bars decompose the complexity score H ^ = 0.40 \hat{H}\!=\!0.40 (Eq. 1 ; LoC, CC, depth) and the inferability score I ^ = 0.48 \hat{I}\!=\!0.48 (Eq. 2 ; five context signals) for 𝙲𝚊𝚕𝚌𝚞𝚕𝚊𝚝𝚘𝚛 . 𝚝𝚘𝚝𝚊𝚕 \mathtt{Calculator.total} , yielding FIM ≈ 0.22 ≥ τ = 0.08 \mathrm{FIM}\!\approx\!0.22\!\geq\!\tau\!=\!0.08 (a hyperparameter; see Appendix B for the full list).

This figure (Figure 2) illustrates the workflow of Function-Aware FIM Target Selection in a small calculator example, divided into three core sections (a, b, c), clearly presenting the complete logic from code structure analysis to target selection:

Section (a): Program Dependency Graph

This part analyzes the code's Abstract Syntax Tree (AST) and visually represents dependencies between functions:
- Code-Graph Correspondence: On the left is a code snippet of the Python class Calculator, containing methods like add, is_int, push, total, and mean; on the right is the dependency graph, where nodes represent methods (e.g., add, is_int, total, etc.) and edges represent call or sibling relationships:
- Solid arrows ($\mathcal{E}{\text{call}}$): Call edges, indicating function call relationships (e.g., total calls is_int, push; push calls mean, etc.).
- Dashed lines ($\mathcal{E}
{\text{sib}}$): Sibling edges, indicating "peer" relationships between methods within the same class (Calculator) (e.g., add, is_int, push, total, mean all belong to the Calculator class and are peer methods).
- Color/Style: top-level (blue) and in-class (green) distinguish top-level functions from class methods (here, Calculator's methods are in-class).

Section (b): Score Breakdown for total Method

This part calculates the complexity ($\hat{H}$) and inferability ($\hat{I}$) of the Calculator.total method and verifies whether it meets the FIM selection criteria:
- Complexity ($\hat{H}$): Decomposed into three metrics (stacked bar): LoC (lines of code, 0.08), CC (cyclomatic complexity, 0.20), depth (call depth, 0.12), with a total of $\hat{H} = 0.40$ (Formula 1).
- Inferability ($\hat{I}$): Decomposed into five contextual signals (stacked bar): caller (caller-related, 0.06), caller (another caller signal? Or a typo; actually different contexts, 0.13), sig (function signature, 0.10), doc (documentation, 0.05), class (class context, 0.14), with a total of $\hat{I} = 0.48$ (Formula 2).
- FIM Calculation and Selection: FIM is defined as $\hat{H} \cdot \hat{I} / (\hat{H} + \hat{I})$ (or a similar normalization method), calculated as $\text{FIM} \approx 0.22$. If FIM ≥ threshold $\tau = 0.08$ (hyperparameter), the method is selected as an FIM target (shown as "selected" in the figure).

Section (c): Selection in $\hat{H}$-$\hat{I}$ Plane

This part visualizes the relationship between complexity ($\hat{H}$, x-axis) and inferability ($\hat{I}$, y-axis) in a 2D plane to explain the selection logic:
- Curve ($\text{FIM} = \tau$): The red curve is the contour where FIM equals the threshold $\tau = 0.08$ (i.e., $\hat{H} \cdot \hat{I} / (\hat{H} + \hat{I}) = \tau$).
- Meaning of Points:
- total (red dot): Located below the curve (or satisfies $\text{FIM} \geq \tau$), indicating it is selected.
- mean (cross), push (cross), is_int (cross), caller (cross): Located above the curve or do not meet the criteria, filtered ("filtered").
- Coordinate Range: x-axis ($\hat{H}$) 0–1, y-axis ($\hat{I}$) 0–1, intuitively showing the trade-off between complexity and inferability of different methods.

Core Logic of the Method's Operation (Derived from the Figure)

  1. Code Structure Analysis: Analyze call/sibling relationships between functions through the program dependency graph (Section a) to identify potential "function call sites" (i.e., FIM target scenarios).
  2. Score Calculation: For the target function (e.g., total), calculate complexity ($\hat{H}$) (reflecting the complexity of the code structure) and inferability ($\hat{I}$) (reflecting the ability of downstream code to infer the function's output) separately, and decompose them into multiple sub-metrics (Section b).
  3. Target Selection: Compare FIM (a combined score of complexity and inferability) with the threshold $\tau$ and select functions with FIM ≥ $\tau$ as FIM targets (Section c). These functions will be used for function-aware FIM pre-training to enable the model to learn the "call-inference" structure and enhance coding capabilities.

This figure intuitively demonstrates the three-step process of "Function-Aware FIM Target Selection" (structure analysis → score calculation → threshold selection) through a small example (calculator), helping to understand how this method selects suitable target functions for pre-training from ordinary code.

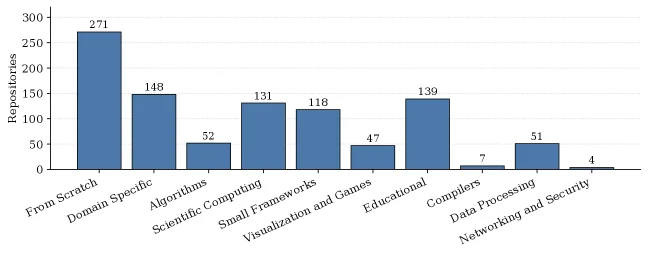
Figure 3: Distribution of the 968 968 source repositories across ten topic categories. The corpus is dominated by reference implementations, scientific computing, and small frameworks; compiler and networking/security tails are kept by design to maintain coverage diversity.

This figure (Figure 3) illustrates the distribution of the 968 source code repositories across ten different topic categories that constitute the 2.6B-token decontaminated corpus used for training the coding agent foundation model. Understanding this figure is crucial as it reveals the composition of the data used, which is central to the "Function-Aware Fill-in-the-Middle" (FIM) mid-training method proposed in the paper.

First, let's break down the components of the graph: - X-axis: Represents ten different topic categories, listed from left to right as: "From Scratch," "Domain Specific," "Algorithms," "Scientific Computing," "Small Frameworks," "Visualization and Games," "Educational," "Compilers," "Data Processing," and "Networking and Security." - Y-axis: Represents the number of repositories (Repositories) within each category, ranging from 0 to 300. - Bar chart: The height of each bar corresponds to the number of repositories in that category. For instance, the "From Scratch" category has 271 repositories, making it the most numerous, while the "Networking and Security" category has only 4 repositories, making it the least numerous.

Next, we analyze the data distribution and its implications: - Primary Components: The corpus is dominated by "Reference Implementations" (corresponding to the "From Scratch" category with 271 repositories), "Scientific Computing" (131 repositories), and "Small Frameworks" (139 repositories). These categories typically contain a large number of representative code examples, algorithm implementations, and reusable library components, which are important for training models to understand and generate complex code. - Secondary Components: Categories like "Domain Specific" (148 repositories), "Algorithms" (52 repositories), "Visualization and Games" (47 repositories), and "Educational" (118 repositories), and "Data Processing" (51 repositories) provide diverse coding scenarios but are relatively less numerous. - Tail Categories: The "Compilers" (7 repositories) and "Networking and Security" (4 repositories) categories have very few repositories. The paper explicitly states these are "kept by design to maintain coverage diversity." This means the researchers intentionally selected these less represented but challenging domains to ensure the model is exposed to a wider range of programming scenarios, even if they are not dominant in the corpus.

This figure reveals how the method (FIM mid-training) is operationalized (i.e., data selection strategy): - The FIM mid-training method relies on a 2.6B-token decontaminated corpus sourced from 968 GitHub repositories. - The distribution in the figure shows how these repositories are classified by topic. By selecting repositories from these specific categories, the researchers ensured the training data included both a large volume of common, foundational code patterns (like scratch implementations, scientific computing, and small frameworks) and some specific-domain and rarer scenarios (like compilers and network security). - This data selection strategy aims to enable the model to learn a broad range of programming knowledge and skills, particularly those related to function calls, which is central to the FIM method. By being exposed to different types of codebases, the model can better understand how functions are called, how arguments are passed, and how return values are used, which are the very capabilities required by coding agents when performing tasks. The core of FIM is training around function call sites, so diverse function usage scenarios are vital.

In summary, this figure, by showing the distribution of the training corpus across ten topic categories, demonstrates that the data selection for the paper's method is carefully designed: it emphasizes categories that numerically dominate and provide foundational programming knowledge, while also preserving tail categories that increase data diversity and challenge. This data distribution helps train a robust coding agent foundation model capable of handling both common coding tasks and specific domain challenges.

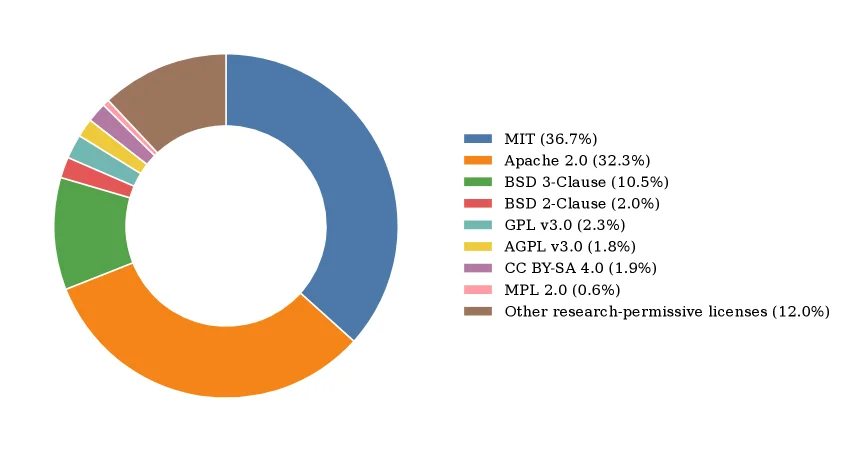
Figure 4: License distribution of the 968 968 -repository corpus. Permissive licenses (MIT, Apache-2.0, BSD) account for over 80 % 80\% of the corpus. Small categories (LGPL, ISC, Boost, MIT-0, Unlicense, CC0, CC BY, CC BY-NC, etc.) are aggregated as “Other research-permissive licenses,” all of which permit at least non-commercial research use.

This figure is a donut chart (or ring chart) illustrating the license distribution of the 968 GitHub repositories that constitute the corpus used in this study. Understanding this chart is crucial for assessing the legal compatibility and scope of the corpus, which is fundamental to the method employed.

First, we examine the legend on the right side of the chart. It clearly lists each color, the corresponding license type, and its percentage share within the corpus. This legend is the key to interpreting the chart.

The main body of the chart is a ring divided into multiple colored segments. The size of each segment is proportional to the percentage of the corpus that the corresponding license type represents. The flow of information is such that the observer associates colors with license types using the legend and then understands the relative importance of each license type based on the size of its corresponding segment in the ring.

Specifically: - The largest segment is blue, representing the "MIT" license, which accounts for 36.7% of the corpus. This is the most common license type. - The next largest segment is orange, representing the "Apache 2.0" license, with a share of 32.3%. This is also a very significant license type. - The green segment represents the "BSD 3-Clause" license, with a share of 10.5%. - The red segment represents the "BSD 2-Clause" license, with a share of 2.0%. - The light blue segment represents the "GPL v3.0" license, with a share of 2.3%. - The yellow segment represents the "AGPL v3.0" license, with a share of 1.8%. - The purple segment represents the "CC BY-SA 4.0" license, with a share of 1.9%. - The pink segment represents the "MPL 2.0" license, with a share of 0.6%. - The brown segment represents "Other research-permissive licenses." This is an aggregate category that includes other licenses such as LGPL, ISC, Boost, MIT-0, Unlicense, CC0, CC BY, CC BY-NC, etc. Collectively, these "other research-permissive licenses" account for 12.0% of the corpus. According to the legend, all these "other research-permissive licenses" permit at least non-commercial research use.

This chart reveals a key aspect of the method (specifically, the corpus construction method) used in this study: the researchers selected code repositories with permissive licenses as the corpus. From the chart, it's clear that just three major permissive licenses—MIT, Apache-2.0, and BSD—constitute over 80% of the corpus (36.7% + 32.3% + 10.5% = 79.5%). This indicates that a significant portion of the code in the corpus is released under license terms that allow free use, modification, and distribution, which is important for training coding agent models that can be safely used for research and development. Furthermore, aggregating several other research-permissive licenses into one category ensures the breadth of the corpus while clarifying its legal usage boundaries (at least allowing non-commercial research).

This is not a result chart but a descriptive chart explaining the characteristics of the data used in the study. It does not have axes, comparison objects (beyond internal comparisons between different license types), or direct conclusive statements. However, its primary implication is that the corpus is predominantly composed of permissively licensed research code, providing a legally sound and practical data foundation for subsequent model training. For instance, code under MIT and Apache-2.0 licenses typically allows commercial use and modification, which is beneficial for developing coding agents that might be applied in various scenarios. By selecting such a license distribution, the researchers ensured that their corpus is both diverse and legally safe for training and evaluating coding agent models, such as Qwen2.5-Coder-Instruct and Qwen3-8B mentioned in the paper.

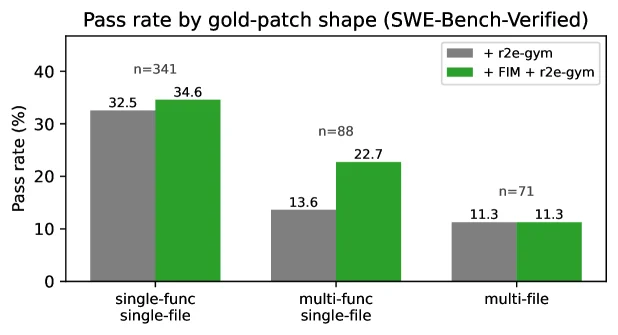
Figure 5: Pass rate on SWE-Bench-Verified ( 14 14 B + R2E-Gym) stratified by gold-patch shape, run-means over three evaluation runs per checkpoint.

This figure illustrates the pass rate on the SWE-Bench-Verified benchmark, stratified by different "gold-patch shapes," and compares the performance of two training methods. Let's break it down step-by-step:

First, the title of the graph is "Pass rate by gold-patch shape (SWE-Bench-Verified)," which clearly indicates that it's a chart showing the relationship between pass rate and patch shape, with data from the SWE-Bench-Verified benchmark.

The X-axis represents three different types of "gold-patch shapes": 1. single-func single-file: This indicates patches that involve only a single function, and this function is located within a single file. 2. multi-func single-file: This indicates patches that involve multiple functions, but all these functions are located within the same file. 3. multi-file: This indicates patches that involve multiple functions, and these functions are distributed across multiple different files.

The Y-axis represents the pass rate, measured in percentage (%), ranging from 0 to 40%.

There are two colored bar charts in the figure, representing two different training methods: * Gray bars: Represent models trained with + r2e-gym. According to the original caption, this refers to the Qwen2.5-Coder-Instruct (14B) model with the R2E-Gym post-training pipeline. * Green bars: Represent models trained with + FIM + r2e-gym. Here, FIM refers to the "Function-Aware Fill-in-the-Middle" method proposed in the paper, meaning that FIM is applied as an intermediate training step in addition to + r2e-gym.

Above each bar, the specific pass rate percentage is labeled. Additionally, some bars have an n= value labeled above them, which represents the sample size used to calculate the average pass rate for that category (e.g., n=341 means 341 samples were used).

Now let's analyze the data presented in the graph:

  1. For single-func single-file patches:

    • The model trained with + r2e-gym achieved a pass rate of 32.5% (n=341).
    • The model trained with + FIM + r2e-gym achieved a pass rate of 34.6% (n=341).
    • This shows that applying the FIM method led to an improvement in pass rate (an increase of about 2.1 percentage points) when dealing with patches involving a single function in a single file.
  2. For multi-func single-file patches:

    • The model trained with + r2e-gym achieved a pass rate of 13.6% (n=88).
    • The model trained with + FIM + r2e-gym achieved a pass rate of 22.7% (n=88).
    • This is a very significant improvement, with the pass rate nearly doubling (an increase of about 9.1 percentage points). This suggests that the FIM method is particularly effective when handling patches involving multiple functions within a single file.
  3. For multi-file patches:

    • The model trained with + r2e-gym achieved a pass rate of 11.3% (n=71).
    • The model trained with + FIM + r2e-gym also achieved a pass rate of 11.3% (n=71).
    • In this case, there was no significant difference in pass rate between the two methods.

The original caption adds that these results are for the Qwen2.5-Coder-Instruct (14B) model using the R2E-Gym post-training pipeline. The pass rates are averages over three evaluation runs for each checkpoint.

This figure reveals how the method (i.e., FIM intermediate training) works and its effectiveness: * Method Operation: The paper proposes an intermediate training objective called FIM, which selects functions to mask using program dependency graph analysis and a complexity-inferability double criterion. This method leverages the function call structure prevalent in code, where a caller binds arguments, a callee returns a value computed elsewhere, and downstream code consumes that value. By simulating this structure during training, the model can learn to better handle function dependencies and the integration of tool return values. * Effectiveness: From the figure, it's clear that FIM intermediate training significantly improves the model's pass rate on the SWE-Bench-Verified benchmark for patches involving single files (whether single or multiple functions). The improvement is most pronounced for the more complex "multi-func single-file" patches. However, for "multi-file" patches, FIM does not show a significant effect. This might imply that FIM is more effective at handling intra-file function interactions and less so for complex cross-file dependencies, or that further optimization is needed.

In summary, this figure clearly demonstrates how the FIM intermediate training method impacts the performance of coding agents on the SWE-Bench-Verified benchmark, particularly for different types of patches varying in complexity and scope. It proves the effectiveness of FIM in enhancing the model's ability to handle function-level and intra-file dependencies.

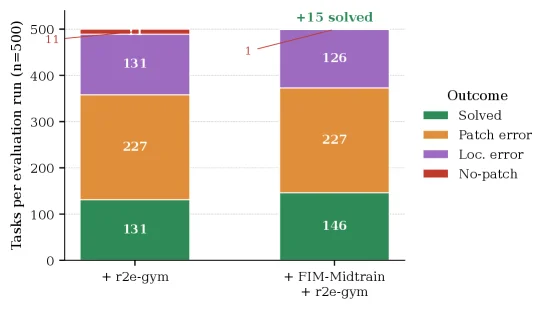
Figure 6: Outcome distribution per evaluation run on SWE-Bench-Verified (14B, R2E-Gym), averaged over three runs.

This figure (Figure 6) illustrates the outcome distribution per evaluation run on the SWE - Bench - Verified benchmark (using the 14B model with the R2E - Gym pipeline), with results averaged over three independent runs.

Axis and Group Definitions:

  • X - axis: There are two main comparison groups. The left group is “+ r2e - gym”, where “r2e - gym” represents a basic training/evaluation post - processing pipeline (e.g., the R2E - Gym pipeline mentioned in the paper). The right group is “+ FIM - Midtrain + r2e - gym”, where “FIM - Midtrain” is the Function - Aware Fill - in - the - Middle mid - training method proposed in the paper.
  • Y - axis: It represents the number of tasks per evaluation run, with a total of 500 tasks (n = 500) being evaluated. The tasks are then classified into different outcome types.

Legend (Outcome Types):

  • Green (Solved): Tasks that are successfully solved by the coding agent.
  • Orange (Patch error): Tasks where the generated patch contains errors.
  • Purple (Loc. error): Tasks where the error lies in the location (e.g., incorrect positioning of code or data).
  • Red (No - patch): Tasks where no patch is attempted (or cannot be applied).

Analysis of Each Group:

  • Left Group (“+ r2e - gym”):
    • The green (Solved) layer has a height of 131, meaning 131 tasks are successfully solved.
    • The orange (Patch error) layer has a height of 227, indicating 227 tasks have patch - related errors.
    • The purple (Loc. error) layer has a height of 131, showing 131 tasks have location - related errors.
    • The red (No - patch) layer has a height of 11, suggesting only 11 tasks have no patch (or cannot be patched).
  • Right Group (“+ FIM - Midtrain + r2e - gym”):
    • The green (Solved) layer has a height of 146. Compared to the left group, the number of solved tasks increases by 15 (as indicated by the red arrow and “+15 solved” label).
    • The orange (Patch error) layer still has a height of 227, meaning the number of patch - error tasks remains unchanged.
    • The purple (Loc. error) layer has a height of 126, which is a decrease from 131 in the left group.
    • The red (No - patch) layer has a height of 1, which is negligible (possibly a labeling detail).

Method Explanation (from the Figure):

The figure compares the performance of two training setups: one with only the “r2e - gym” pipeline and one with the “FIM - Midtrain” mid - training method added to the “r2e - gym” pipeline. The mid - training (FIM - Midtrain) aims to improve the coding agent's ability to integrate external tool returns into ongoing reasoning by leveraging the function - call structure in code (as described in the paper's abstract). From the result distribution, we can see that mid - training increases the number of solved tasks (+15) and reduces the number of location - error tasks (from 131 to 126), while the number of patch - error tasks remains the same. This shows that the mid - training method (using function - call structure for self - supervised learning) can enhance the coding agent's performance on the SWE - Bench - Verified benchmark.

Conclusion from the Figure:

The mid - training (FIM - Midtrain) has a positive impact on the coding agent's performance. Specifically, it solves more tasks (+15) and reduces location - related errors, while the number of patch - related errors does not change. This verifies that the proposed method (mid - training with function - aware fill - in - the - middle) can effectively improve the coding agent's performance on real - world coding benchmarks.

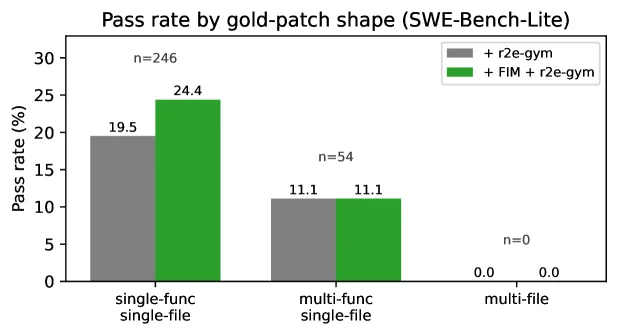
Figure 7: Pass rate on SWE-Bench-Lite stratified by gold-patch shape, averaged over three evaluation runs per checkpoint. Lite contains no multi-file tasks; the multi-function single-file bucket is small ( n = 54 n{=}54 ) and shows no gain on this slice, with the + 4.0 +4.0 pp end-task improvement coming entirely from the single-function single-file bucket ( n = 246 n{=}246 , + 4.9 +4.9 pp).

This figure illustrates the pass rate on the SWE - Bench - Lite benchmark, stratified by "gold - patch shape" (i.e., the structural type of tasks), and compares two methods: one using only + r2e - gym and the other using + FIM + r2e - gym (where FIM is the function - aware fill - in - the - middle method proposed in the paper). Let's analyze it part by part:

Axes and Grouping

  • Y - axis: Represents the pass rate (in percentage %), ranging from 0 to 30, which is used to measure the proportion of tasks successfully solved by the model for the corresponding task type.
  • X - axis: Classifies tasks into three types according to the "gold - patch shape":
    • single - func single - file: Tasks where the patch involves only a single function and a single file. The sample size n = 246 (i.e., there are 246 such tasks for evaluation).
    • multi - func single - file: Tasks where the patch involves multiple functions but a single file. The sample size n = 54 (a relatively small number of tasks).
    • multi - file: Tasks where the patch involves multiple files. The sample size n = 0 (i.e., there are no such tasks in SWE - Bench - Lite).

Comparison of Different Methods (Bar Charts)

For each type of task, there are two bar charts representing two methods: - Gray bar (+ r2e - gym): This is the pass rate of the baseline method (or the method using only r2e - gym). - For single - func single - file tasks, the pass rate is 19.5%. - For multi - func single - file tasks, the pass rate is 11.1%. - For multi - file tasks, the pass rate is 0.0% (because there are no such tasks). - Green bar (+ FIM + r2e - gym): This is the pass rate after adding the FIM method (proposed in the paper) on the basis of the baseline method. - For single - func single - file tasks, the pass rate is 24.4%, which is significantly higher than the 19.5% of the baseline method, with an improvement of about 4.9 percentage points (consistent with the "+ 4.9 pp" mentioned in the caption). - For multi - func single - file tasks, the pass rate is 11.1%, the same as the baseline method, indicating that FIM does not bring improvement in this small - sample task type (also mentioned in the caption: "shows no gain on this slice"). - For multi - file tasks, the pass rate is 0.0%, the same as the baseline method (because there are no such tasks).

Method Operation Logic (Combined with the Paper)

From the figure, we can see that the paper's method (FIM) mainly works on the single - function single - file task type. According to the paper's abstract, FIM is a self - supervised objective that masks functions selected by program dependency graph analysis and a complexity - inferability double criterion, simulating the "action - observation - continuation" loop of a coding agent (similar to a function call site, where the caller binds arguments, the callee returns a computed value, and downstream code consumes that value). This method utilizes the large - scale function call structure existing in ordinary code, and fine - tunes the model after pre - training (mid - training), thus improving the model's performance in coding agent benchmarks such as SWE - Bench - Lite. From the results in the figure, FIM significantly improves the pass rate for single - function single - file tasks, while having no obvious effect on multi - function single - file (small - sample) and multi - file (no task) tasks, which also verifies the statement in the caption that "the end - task improvement comes entirely from the single - function single - file bucket".

Conclusion

This figure clearly shows the improvement effect of the FIM method on the coding agent model in the SWE - Bench - Lite benchmark: it mainly improves the pass rate of single - function single - file tasks, while having no obvious impact on multi - function single - file (small - sample) and multi - file (no task) tasks. This indicates that the FIM method can utilize the function call structure in the code to enhance the model's coding ability in specific task types (single - function single - file).

← → flip · ↑ ↓ scroll notes · Esc exit