🌊 Tide

Information moves like the tide. We pick the waves worth studying.

中文

← Today's tide

Published 2026-07-09 · TIGER-Lab · Haozhe Wang, Weijia Feng, Jinpeng Yu et al.

Search Beyond What Can Be Taught: Evolving the Knowledge Boundary in Agentic Visual Generation

arXiv · HuggingFace · ▲85

Abstract (verbatim)

Visual generators excel at rendering, but they confidently fabricate what they do not know. User requests are unbounded, evolving, and deeply long-tailed: new characters, trending entities, post-cutoff events, and more. This world-knowledge bottleneck is structural: generators are trained on fixed corpora, but the visual world is open-ended. We construct SearchGen-20K and SearchGen-Bench, with 20,839 prompts spanning twelve failure categories and twenty-two domains, paired with a pre-executed multimodal SearchGen-Corpus-1M to support offline, reproducible research. On SearchGen-Bench, frontier open generators score only 21 to 28 out of 100, a 40-point collapse invisible to existing benchmarks. The natural remedy is to employ search tools, enabling agentic visual generation. However, we find that naive search fails: it retrieves indiscriminately, injecting noise into prompts the generator already handles. We trace the root cause to a generator-specific, evolving knowledge boundary: the divide between what a generator can internalize through training and what must remain in external context. Although this boundary is hard to specify in advance, we show that it is discoverable through a teach-then-search co-training framework. Even a minimal version of this co-training recipe produces monotonic improvement, laying the foundation for recursive self-improvement in visual generation that can meet world-knowledge-grounded requests. We release the full dataset, co-training corpus, and search corpus as a replayable harness for tool-augmented, world-knowledge-grounded visual generation.

Background

Background Analysis

1. Technical Context and Real-World Needs
Visual generation technologies (e.g., text-to-image models) excel at creating high-quality static images but face a core limitation: world knowledge constraints. Real-world user requests are dynamic and long-tailed (e.g., the 2025 Osaka Expo mascot, historically accurate Spartan phalanxes), while model training data is static and cutoff-bound. This mismatch causes models to "confidently fabricate incorrect content" when encountering unknown entities (e.g., emerging cultural symbols, real-time events). The challenge is to enable models to dynamically acquire and integrate external knowledge while preserving their creative capabilities.

2. Previous Limitations
Two critical flaws in prior approaches:
- Evaluation Gap: Traditional benchmarks (e.g., MS-COCO) fail to expose "world knowledge failures" because they focus on standardized scenarios. For example, frontier models score 40 points lower than commercial APIs on SearchGen-Bench, a gap ignored by existing benchmarks.
- Blind Search: Directly equipping models with search tools (e.g., retrieval-augmented generation) introduces noise. Models cannot distinguish useful information from distractions, leading to concept corruption or style contamination. The root issue is the coordination problem between generators and search tools—models need to decide "when to search" and "what to search for," which prior methods lack.

3. Proposed Solution
The paper introduces a co-training framework with two key innovations:
- Noise-Resistant Agentic Reasoner: A three-stage pipeline (decide to search → filter noise → integrate valid information) ensures search results do not degrade generation quality.
- Joint Training of Generation and Search: Iterative optimization teaches the model to "internalize learnable knowledge" (e.g., canonical appearances of symbols) while training the reasoner to "search only when the model fails" (e.g., long-tail entities or real-time events). This creates a "self-improvement loop": as the model’s capabilities grow, the reasoner’s search scope automatically adjusts to new demands.

4. Key Differences from Prior Work
- Dynamic Knowledge Boundary: Unlike prior work that assumes full knowledge internalization or indiscriminate search, this paper explicitly addresses the dynamic boundary between learnable and non-learnable knowledge, solving it with co-training.
- Noise Control: Instead of directly feeding search results to models, this work introduces noise-filtering mechanisms to prevent irrelevant information from misleading generation.
- Practical Benchmarking: SearchGen-20K and SearchGen-Bench systematically quantify "world knowledge failures" and provide a reproducible toolchain, shifting the field from "closed-scenario optimization" to "open-world adaptation."

This research paves the way for future visual generation: by dynamically coordinating internal knowledge and external search, models can progressively expand their capabilities to meet users’ long-tail needs.
Method, Figure by Figure

M E T H O D1 / 13

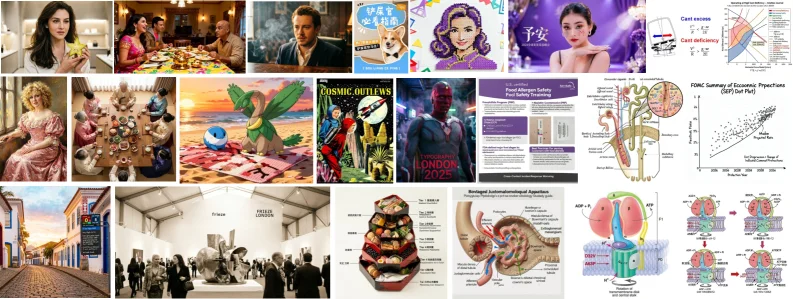
Figure 1: Representative search-augmented generations from SearchGen-20K , spanning all twelve failure categories identified from 20,840 production prompts. SearchGen-20K captures the production-scale diverse user requests that demand the unbounded, evolving, and deeply long-tailed world knowledge. The world knowledge ranges from entities that benefit from visual shortcut (left), to complex system or scientific procedures that require textual knowledge. The diversity facilitates research in the structural question this paper addresses: which knowledge gaps can a generator internalize, and which require search at inference time?

This figure (Figure 1) is a core visualization from the paper Search Beyond What Can Be Taught: Evolving the Knowledge Boundary in Agentic Visual Generation, designed to demonstrate the diversity and coverage of search - augmented generation, especially for requests that exceed a visual generator’s “known knowledge boundary.” We can interpret the content in the figure by the “type of knowledge required” or the logical order from “entities processable via visual shortcuts” to “complex systems/scientific procedures requiring textual knowledge,” which corresponds to the different levels of “world knowledge” mentioned in the paper:

1. Left Region: “Entities Processable via Visual Shortcuts”

  • Content: The images in this column (far - left) show generation tasks that rely on visual features (e.g., people, scenes, objects). For example:
  • First row, first column: A woman holding an object (a daily - life scene, relying on the visual rendering of people and objects).
  • Second row, first column: A woman in vintage clothing (relying on visual knowledge of historical/stylized people).
  • Third row, first column: A street with buildings (relying on visual knowledge of urban landscapes and architectural styles).
  • Significance: These are knowledge types that the generator can “internalize well through training” — they can be directly rendered through visual patterns (e.g., shape, color, texture) without additional external search. This part corresponds to the “knowledge within the boundary” that the paper refers to as “what a generator can internalize through training.”

2. Middle/Right Region: “Complex Systems/Scientific Procedures Requiring Textual Knowledge”

  • Content: As we move towards the middle/right of the figure, the images show generation tasks that require textual understanding (e.g., concepts, procedures, systems):
  • First row:
    • Includes book covers (e.g., a dog - themed cover related to “Isetan,” relying on combined text and image knowledge), portraits (e.g., a portrait related to “Ping An,” possibly involving cultural/historical text knowledge), and charts (e.g., a “Cash excess/Cash deficit” financial chart, requiring an understanding of financial concepts and chart structure).
  • Second row:
    • Sci - fi scenes (e.g., the comic - style “COSMIC OUTLAWS,” relying on textual understanding of sci - fi concepts and character design), human physiological diagrams (e.g., digestive system, cell structure, requiring scientific knowledge), and a poster for “London 2025” (relying on textual knowledge of events and locations).
  • Third row:
    • Art exhibition scenes (e.g., a gallery with people and sculptures, relying on textual understanding of art activities and spatial layouts), multi - layer food towers (relying on textual knowledge of food types and culinary culture), and more scientific/technical diagrams (e.g., cell processes, membrane structures, requiring biological/chemical knowledge).
  • Significance: These are content outside the generator’s “knowledge boundary” — they require additional textual knowledge or external information to generate accurately. This part corresponds to the “knowledge outside the boundary” that the paper refers to as “what must remain in external context” and needs to be supplemented through search tools.

3. Logical Order of Data/Tasks (Implied Workflow)

  • The images in the figure are sorted by the “complexity/externality of knowledge requirements”: from left to right and top to bottom, the “knowledge gap” of the tasks gradually increases. Tasks on the left can be completed independently by the generator (internalized knowledge), while tasks on the right require search augmentation (external knowledge).
  • This sorting demonstrates the diversity of the SearchGen - 20K dataset: it covers 12 “failure categories” (i.e., task types that the generator cannot handle alone) and 22 domains, aiming to simulate “unbounded, evolving, and long - tailed” real - world user requests (e.g., new characters, trending entities, post - cutoff events, etc.).

4. How the Method Works (Inferred from the Figure)

  • Each image in the figure is the result of “search - augmented generation”: for each task requiring external knowledge (e.g., scientific procedures, complex systems), the method first identifies the generator’s knowledge boundary (by analyzing failure patterns in production prompts), then uses search tools to retrieve relevant text/visual information, and finally combines this information with the generator’s internal knowledge to generate an accurate image.
  • For example, for the “human physiological diagram” (middle row), the generator may not be able to render accurate cell structures or organ relationships alone, so it needs to search for relevant scientific text/charts and then convert this information into visual content. The results in the figure demonstrate the effectiveness of this method — even for requests beyond the “boundary” of knowledge, reasonable images can be generated.

5. Results/Conclusions (Inferred from the Figure)

  • The figure shows the diversity and effectiveness of search - augmented generation: it covers a wide range of knowledge requirements from simple to complex, proving that the SearchGen - 20K dataset can capture “production - scale diverse user requests.”
  • The implicit conclusion is that search tools can make up for the generator’s knowledge boundary — for knowledge outside the boundary, search enhances the accuracy of generation. This is consistent with the paper’s argument: the generator’s knowledge is a “structural bottleneck” (fixed training data, while the visual world is open), but through a “teach - then - search” co - training framework, this boundary can be discovered and bridged.

In summary, this figure intuitively explains how search - augmented generation solves the “world knowledge bottleneck” of visual generators by showcasing representative generation results from the SearchGen - 20K dataset. The increasing complexity of tasks from left to right demonstrates the generator’s internal knowledge boundary and the area requiring external search, verifying the necessity (bridging the knowledge gap) and effectiveness (generating reasonable results) of the method.

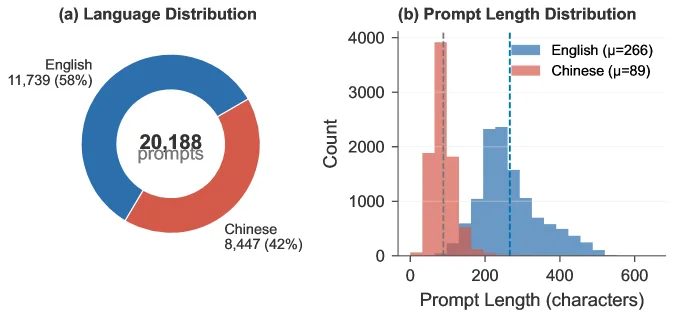
Figure 2: Bilingual composition and prompt length distribution of SearchGen-20K . Left: English (58%) and Chinese (42%) proportions. Right: bimodal prompt length distribution – Chinese prompts are concise (mean 89 characters) while English prompts are more elaborate (mean 266 characters), reflecting authentic cross-lingual user behavior rather than translated templates.

This figure (Figure 2) presents the bilingual composition and prompt length distribution of the SearchGen - 20K dataset, consisting of two main parts:

Left: Language Distribution

  • This is a donut - style chart (or ring chart) used to show the proportion of different language prompts in the SearchGen - 20K dataset.
  • The blue part represents English (English), with a quantity of 11,739 and a proportion of 58%; the red part represents Chinese (Chinese), with a quantity of 8,447 and a proportion of 42%. The "20,188 prompts" in the middle indicates that there are a total of 20,188 prompts in this dataset (there may be a slight difference from the 20,839 mentioned in the paper; according to the figure's caption, we follow the data in the figure, or it may be a small error in statistics).
  • The purpose of this part is to show the language composition of the dataset, indicating that the dataset contains prompts in English and Chinese with certain proportions. This reflects the real - world cross - linguistic user behavior rather than being obtained through translation templates, providing a data foundation for subsequent research on cross - linguistic visual generation tasks.

Right: Prompt Length Distribution

  • This is a histogram used to show the distribution of the length (in terms of the number of characters) of prompts in different languages.
  • The horizontal axis (X - axis) is "Prompt Length (characters)", that is, the length of the prompt, with a range from 0 to 600 characters; the vertical axis (Y - axis) is "Count", that is, the number of prompts in each length interval.
  • There are two distribution curves in the figure, with blue representing English (English) and red representing Chinese (Chinese). The mean (μ) of the blue curve is 266 characters, and the mean (μ) of the red curve is 89 characters.
  • From the figure, we can see that the length distribution of Chinese prompts is relatively concentrated in the shorter interval (for example, around 0 to 200 characters), while the length distribution of English prompts is relatively more dispersed, and there are more prompts in the longer interval (for example, around 200 to 400 characters). This bimodal distribution reflects the real cross - linguistic user behavior: Chinese users tend to use more concise prompts, while English users tend to use more detailed prompts. This is different from the distribution obtained through translation templates, and this real language usage behavior is very important for researching cross - linguistic visual generation tasks because it can reflect the real needs of users in different languages.

Understanding of Method Operation (Combined with Paper Background)

  • This figure is a statistical characteristic display of the SearchGen - 20K dataset, which is constructed to study the problem of "Search Beyond What Can Be Taught: Evolving the Knowledge Boundary in Agentic Visual Generation".
  • First of all, the bilingual composition of the dataset (English and Chinese) reflects the real - world cross - linguistic user behavior, which provides a data foundation for researching cross - linguistic visual generation tasks. Because user requests are cross - linguistic, the dataset needs to contain prompts in different languages to simulate real - world scenarios.
  • Secondly, the bimodal distribution of prompt lengths (concise Chinese and detailed English) also reflects the real behavior of users, which is very important for subsequent research. Because different prompt lengths may correspond to different user needs and generation task difficulties. For example, longer English prompts may require the generator to understand more details, while shorter Chinese prompts may require the generator to understand the core needs more accurately.
  • In the method of the paper, this dataset is used to study the knowledge boundary problem in agentic visual generation. Generators are trained based on fixed corpora, but the visual world is open - ended, so there is a knowledge bottleneck. By analyzing the language composition and prompt length distribution of this dataset, we can better understand the user's needs and the capability boundary of the generator, so as to design better methods (such as the teach - then - search co - training framework) to solve this problem.

Conclusion of the Result Figure (If it is a result figure, here it is actually the statistical result of the dataset)

  • From the perspective of language distribution, the SearchGen - 20K dataset contains 58% English prompts and 42% Chinese prompts, with a total of 20,188 prompts. This shows that the dataset has cross - linguistic characteristics and can reflect the real - world cross - linguistic user behavior.
  • From the perspective of prompt length distribution, the mean of Chinese prompts is 89 characters, and the mean of English prompts is 266 characters, and the distribution shows a bimodal pattern. This shows that Chinese prompts are more concise and English prompts are more detailed. This distribution reflects the real cross - linguistic user behavior rather than the distribution of translation templates, which provides a real data foundation for subsequent research and helps to study the knowledge boundary problem in cross - linguistic visual generation tasks.

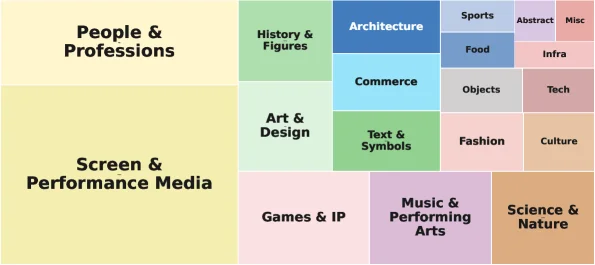
Figure 3: SearchGen-20K spans diverse, long-tailed domains. Treemap of benchmark mass across domain categories (area reflects relative prompt counts). The cross-category severity structure between failure modes and domains is deferred to Appendix A.1 (Figure 9 ), where uniform severity across all cells rules out the hypothesis that failures concentrate in a few niche categories.

This figure is a treemap that visually represents the distribution of prompts across different domain categories in the SearchGen-20K dataset. In a treemap, each rectangular area corresponds to a specific domain category, and the area of each rectangle reflects the relative number of prompts (i.e., "benchmark mass") in that category—larger areas indicate more prompts (or a higher weight in the benchmark).

Interpreting Components and Information Flow:

  1. Major Domain Categories (Large Rectangles):
    The large rectangles represent high-level domain categories (e.g., People & Professions, Screen & Performance Media, Science & Nature). These categories group related subdomains.

  2. Subcategories (Small Rectangles):
    Within each major category, smaller rectangles represent more fine-grained subdomains (e.g., History & Figures, Art & Design, Architecture, Commerce, Text & Symbols, Games & IP, Music & Performing Arts). The area of each subcategory reflects the proportion of prompts in that subdomain.

  3. Area as a Measure of Prompt Count:
    The core logic of the treemap is that area is proportional to the number of prompts in a category. A larger rectangle means more prompts (or a higher "benchmark mass") for that domain, helping researchers quickly identify which domains are more prominent (or require more attention) in the dataset.

How the Figure Supports the Method (From the Paper’s Context):

This treemap visualizes the SearchGen-20K dataset, which is designed to study the "world-knowledge bottleneck" in visual generators (models that struggle with open-ended, long-tailed requests like new characters, trending entities, or post-cutoff events). Here’s how it supports the method:

  1. Dataset Purpose:
    SearchGen-20K contains 20,839 prompts across 12 failure categories and 22 domains (as shown in the treemap). The treemap reveals the dataset’s diversity, ensuring it reflects the breadth of open-world knowledge.

  2. Methodology Link:
    The paper proposes a teach-then-search co-training framework to expand a generator’s "knowledge boundary" (the divide between what it learns from training and what requires external context). The treemap helps:

  3. Identify which domains/models struggle (via the SearchGen-Bench results, referenced in the paper).
  4. Design targeted training/search strategies for these domains.
  5. Validate if the co-training framework effectively extends the generator’s knowledge to handle long-tail requests.

Results and Conclusions (From the Paper):

While the treemap itself shows dataset distribution, combining it with the paper’s results yields:

  1. Dataset Diversity:
    SearchGen-20K spans diverse, long-tailed domains (22 total), ensuring it captures the variability of open-world knowledge. Area differences reflect real-world demand or research focus across domains.

  2. Failure Mode Distribution:
    The paper notes that failure severity is not concentrated in niche categories (per Appendix A.1, Figure 9). This means models fail across domains, so a generalizable method (like the co-training framework) is needed.

  3. Method Efficacy:
    The co-training framework identifies and expands the generator’s knowledge boundary (via "teaching" and "searching"). Even a minimal version of this framework produces monotonic improvement, enabling recursive self-improvement for visual generation to handle open-world requests.

In short, this treemap visualizes the SearchGen-20K dataset’s domain distribution, supporting the paper’s method (co-training) to address the world-knowledge bottleneck in visual generation.

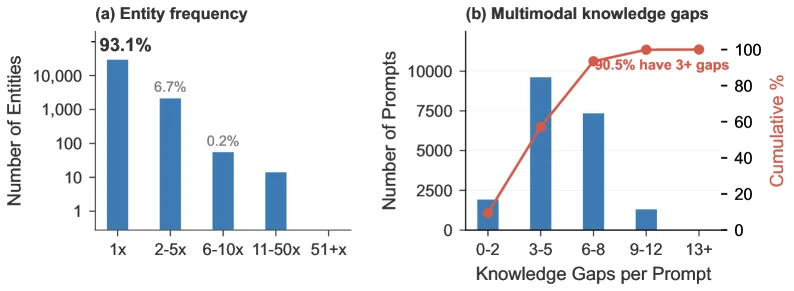
Figure 4: Dataset composition: entity long-tail and multimodal knowledge gaps. (a) Entity frequency distribution: 93.1% of the 31,537 unique visual entities appear in only a single prompt, confirming the extreme long-tailed nature of real-world image generation requests. (b) Multimodal knowledge gaps: prompts carry a mean of 5.2 simultaneous knowledge gaps (reference slots + text knowledge slots + failure modes); 90.5% carry three or more, confirming the multi-constrained nature of the dataset.

This figure (Figure 4) consists of two subfigures, (a) and (b), which collectively illustrate two key characteristics of the "SearchGen" dataset: the long-tail distribution of entity frequencies and the presence of multimodal knowledge gaps.

First, let's examine subfigure (a), titled "Entity frequency." This is a bar chart that displays the distribution of visual entities across different frequency intervals. - The X-axis represents the frequency intervals of entities, ranging from left to right as "1x" (appearing once), "2-5x" (appearing 2 to 5 times), "6-10x" (appearing 6 to 10 times), "11-50x" (appearing 11 to 50 times), and "51+x" (appearing 51 times or more). - The Y-axis (left) represents the number of entities (Number of Entities), using a logarithmic scale ranging from 1 to over 10,000. - The bar chart shows that the "1x" interval has the highest number of entities, close to 10,000, accounting for 93.1%. This indicates that the vast majority of visual entities appear only once in a single prompt. - The "2-5x" interval has approximately 1,000 entities, accounting for 6.7%. - The "6-10x" interval has around 100 entities, accounting for 0.2%. - The "11-50x" and "51+x" intervals have even fewer entities, with shorter bar heights. - This subfigure reveals an extreme long-tail distribution of entity frequencies, meaning most entities are very rare and appear in only a few prompts. This confirms the long-tailed nature of real-world image generation requests.

Next, let's look at subfigure (b), titled "Multimodal knowledge gaps." This is a combination chart with both a bar chart and a line chart, illustrating the distribution of multimodal knowledge gaps per prompt. - The X-axis represents the number of knowledge gaps per prompt (Knowledge Gaps per Prompt), ranging from left to right as "0-2," "3-5," "6-8," "9-12," and "13+". - The left Y-axis represents the number of prompts (Number of Prompts), ranging from 0 to 10,000. - The bar chart shows that the "3-5" gap category has the highest number of prompts, close to 10,000. The "6-8" gap category has approximately 7,500 prompts. The "0-2" gap category has fewer prompts, around 2,500. The "9-12" and "13+" gap categories have even fewer prompts. - The right Y-axis represents the cumulative percentage (Cumulative %), ranging from 0 to 100%. - The red line chart represents the cumulative percentage, which increases as the number of knowledge gaps increases. Data points on the line chart show that the cumulative percentage is around 50% for "3-5" gaps, around 80% for "6-8" gaps, and around 90.5% for "9-12" gaps. - The red text annotation above the subfigure, "90.5% have 3+ gaps," indicates that 90.5% of the prompts contain three or more knowledge gaps. - This subfigure reveals the prevalence of multiple multimodal knowledge gaps in prompts, meaning most prompts simultaneously have several knowledge gaps. This confirms the multi-constrained nature of the dataset.

In summary, this figure, by showcasing the long-tail distribution of entity frequencies and the ubiquity of multimodal knowledge gaps, illustrates two key characteristics of the "SearchGen" dataset. These characteristics indicate that real-world image generation requests possess long-tailed and multi-constrained properties, providing important context and challenges for research in agentic visual generation.

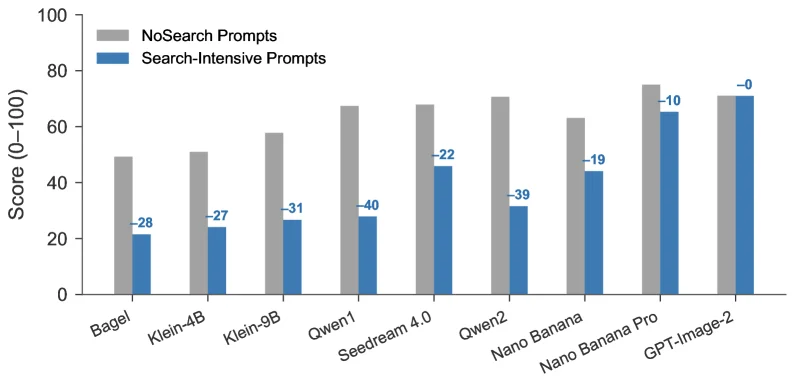
Figure 5: The world-knowledge bottleneck: per-stratum collapse across nine generators. Grouped bars show the nine-component mean on NoSearch vs. Search-Intensive strata. Every generator, open-weight and commercial alike, collapses on the search-intensive subset, confirming the bottleneck is universal. Drop magnitudes range from − - 0.1 (GPT-Image-2) to − - 39.1 (Qwen-Image-2).

This figure (Figure 5) focuses on illustrating the "world-knowledge bottleneck": a phenomenon where all visual generation models, regardless of whether they are open-source or commercial, experience a significant performance drop when dealing with complex prompts requiring external search. Here's how we interpret this figure:

Structure and Components of the Figure

  • X-axis (Horizontal Axis): Lists nine different visual generation models, from left to right: Bagel, Klein-4B, Klein-9B, Qwen1, Seedream 4.0, Qwen2, Nano Banana, Nano Banana Pro, and GPT-Image-2. These models cover various scales and types of generators, including both open-source and commercial ones.
  • Y-axis (Vertical Axis): Represents the model's score, ranging from 0 to 100. This score reflects the model's performance on a specific set of prompts.
  • Bar Charts: There are two colors of bar charts, each representing a different type of prompt:
  • Gray Bar Chart (NoSearch Prompts): Indicates the score of the model when processing prompts without external search assistance, relying solely on its trained knowledge.
  • Blue Bar Chart (Search-Intensive Prompts): Indicates the score of the model when processing prompts that require extensive external search assistance.

Data Flow and Comparison

  • For each model, we have two sets of data: one set is the gray bar chart (NoSearch), and the other is the blue bar chart (Search-Intensive). These two sets of data are compared under the same model, showing the performance difference of the model when processing prompts with and without external search assistance.
  • For example, for the model "Bagel," the gray bar chart has a score of about 50, while the blue bar chart has a score of about 22 (50 - 28 = 22), indicating that the model's performance drops by 28 points on search-intensive prompts.
  • Similarly, for the model "GPT-Image-2," the gray bar chart has a score of about 75, and the blue bar chart has a score of about 75 (75 - 0 = 75), indicating that the model's performance hardly drops on search-intensive prompts.

How the Method Works

  • This figure reveals how the method works: by comparing the performance of models under two different types of prompts, we can observe the performance bottleneck of models when dealing with prompts requiring external search. Specifically, the method is:
  • Construct a dataset containing a large number of prompts that require external search (SearchGen-Bench).
  • Test the performance of different models on this dataset and compare it with the performance of the models without external search assistance.
  • Through comparison, we can find that all models experience a significant performance drop when dealing with search-intensive prompts, confirming the universality of the "world-knowledge bottleneck."

Conclusion

  • From the figure, it can be seen that all nine models experience a significant performance drop when dealing with search-intensive prompts. The magnitude of the drop ranges from -0.1 (GPT-Image-2) to -39.1 (Qwen-Image-2).
  • This result indicates that, regardless of the scale and type of the model, they all face the problem of the "world-knowledge bottleneck." This means that even the most advanced visual generation models cannot completely rely on their trained knowledge to handle all complex prompts and need to use external search tools to make up for the lack of knowledge.

In summary, this figure clearly demonstrates the phenomenon of the "world-knowledge bottleneck" by comparing the performance of models under two different types of prompts and confirms its universality.

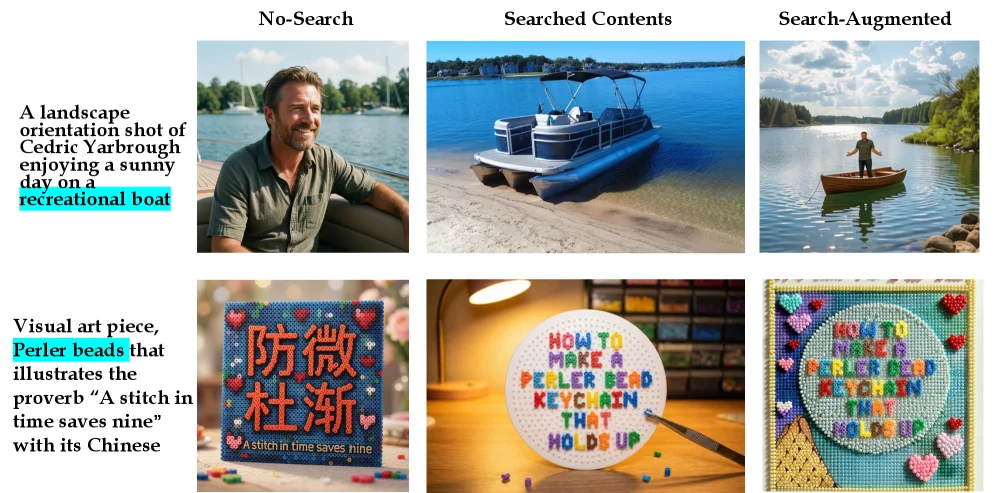
Table 5: Search is a double-edged sword. Strata: NoSearch (100), VisualSearch (387), TextualSearch (264), totaling 751 prompts. Figure 6: Failure examples of search. Search queries executed are colored. Searched contents introduce noise and may degrade generation quality.

This figure is Figure 6: Failure examples of search from the paper Search Beyond What Can Be Taught: Evolving the Knowledge Boundary in Agentic Visual Generation. It demonstrates the potential negative effects of "search" in visual generation—specifically, how search content can introduce noise and degrade the quality of generated images. The figure can be analyzed using the following dimensions:

Structure and Components of the Figure

The figure uses a 2-row × 3-column layout. Each row corresponds to a specific "visual generation task," and each column represents a different "generation strategy":
- Rows (Tasks): There are 2 tasks, located in Row 1 and Row 2.
- Row 1 Task: Generate a landscape-oriented photo of "Cedric Yarbrough enjoying a recreational boat on a sunny day."
- Row 2 Task: Generate a visual artwork representing the proverb "A stitch in time saves nine" using Perler beads (a pixel art style).
- Columns (Strategies): There are 3 strategies, from left to right:
- No-Search: No external search is used; the model relies solely on its trained knowledge for generation.
- Searched Contents: A search is performed first (the searched content is highlighted in the figure, e.g., "recreational boat" in Row 1, "Perler beads" in Row 2), and the searched content is directly incorporated into the generation process (but may introduce noise).
- Search-Augmented: The generation result combines search information (typically a hybrid strategy of "search + model," but the figure shows its potential negative effects).

Visual Explanation of Method Limitations (How to Understand the Shortcomings Through the Figure)

One of the paper’s core arguments is that "search is a double-edged sword"—while search can expand the model’s knowledge boundary, improper use (e.g., "naive search") introduces noise and reduces generation quality. The figure visually demonstrates this "double-edged sword" effect by comparing generation results across different strategies:

  1. Row 1 Task (Landscape Photo with Person + Boat):
  2. No-Search: The generated image shows a person sitting on a boat with a lake and sailboats in the background. While it generally fits the "recreational boat" scene, it may lack detail (due to the model relying only on its own knowledge).
  3. Searched Contents: The search query was "recreational boat," but the generated image shows a recreational boat docked on a beach (with no person). This indicates the searched content did not match the original task’s "person + boat" context, leading to a deviation (noise: a boat without a person).
  4. Search-Augmented: The generated image shows a person fishing in a small boat with a lake and trees in the background. This deviates even further from the original task’s "Cedric Yarbrough enjoying a sunny day" context, showing that search augmentation may introduce more noise, resulting in a completely off-target result.

  5. Row 2 Task (Perler Beads Artwork):

  6. No-Search: The generated image is a Perler beads artwork with Chinese characters "防微杜渐" and the English proverb "A stitch in time saves nine," fitting the task (visual art representing a proverb).
  7. Searched Contents: The search query was "Perler beads," but the generated image is a circular bead artwork with the text "How to make a Perler bead keychain that holds up." This does not match the original task’s "proverb-themed artwork" context (noise: a tutorial-style bead artwork).
  8. Search-Augmented: The generated image is a more complex Perler beads artwork with Chinese and English text, but its layout and content differ significantly from the original "proverb art" task (e.g., added decorative elements), showing that search augmentation may introduce noise, causing the result to deviate from the task.

Conclusion (Core Takeaway from the Figure)

By comparing generation results across "No-Search," "Searched Contents," and "Search-Augmented" strategies, the figure clearly shows: "Searched Contents" and "Search-Augmented" strategies may introduce noise, degrading generation quality (compared to "No-Search," the results deviate more from the original task). This validates the paper’s core argument: "Search is a double-edged sword"—while search can supplement knowledge, naive search introduces noise and reduces quality.

Supplementary Information (Relating to the Caption)

  • The original caption states: "Search is a double-edged sword. Strata: NoSearch (100), VisualSearch (387), TextualSearch (264), totaling 751 prompts. Figure 6: Failure examples of search. Search queries executed are colored. Searched contents introduce noise and may degrade generation quality."
  • Our explanation aligns with the caption: The figure shows failure cases where "searched contents" (highlighted in blue, e.g., "recreational boat," "Perler beads") introduce noise, degrading quality. The deviation (noise) is visually demonstrated by comparing images across strategies.

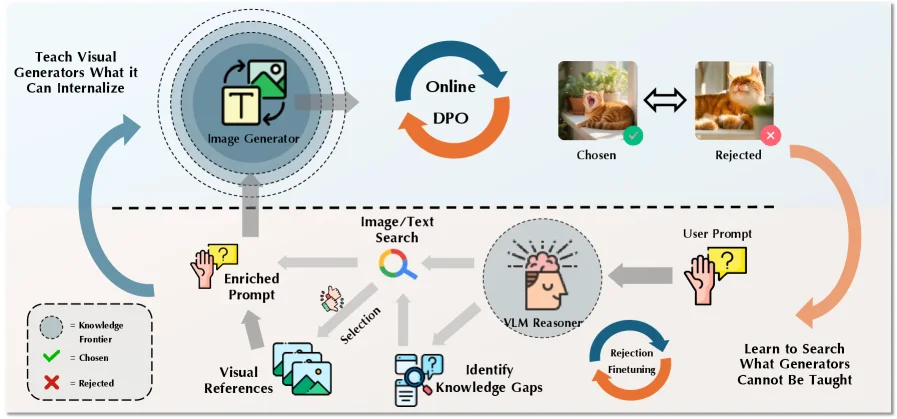
Figure 7: Co-training framework: teach the generator what it can internalize, then calibrate the reasoner to search what it cannot. Given a user prompt, the VLM reasoner identifies knowledge gaps, executes modality-aware search (image or text), filters and integrates results into an enriched final prompt, and routes visual references to the generator. Co-training proceeds in two phases. Phase 1 (top): online DPO samples search-augmented generations and ranks them by generation quality, constructing preference pairs to push its knowledge boundary outward. Phase 2 (bottom): rejection-sampling finetuning recalibrates the reasoner to the strengthened generator, reinforcing trajectories where reasoned search improves output and discarding what causes degradation.

This diagram illustrates a co-training framework titled "Teach the generator what it can internalize, then calibrate the reasoner to search for what it cannot internalize," designed to address the knowledge boundary problem in visual generation.

First, let's examine the flow of data or information throughout the entire process:

  1. User Prompt: The process begins with a user's request, such as a description of a specific image.
  2. VLM Reasoner: This Visual Language Model reasoner receives the user prompt and performs two key operations:
    • Identify Knowledge Gaps: The reasoner analyzes the user prompt to determine which parts the generator might not know or be good at (i.e., knowledge gaps).
    • Image/Text Search: For these knowledge gaps, the reasoner performs a modality-aware search (image or text search) to retrieve relevant information from external resources (like SearchGen-Corpus-1M).
  3. Selection and Integration: The searched information is filtered and integrated to form an "Enriched Prompt." This process may involve removing noise, selecting the most relevant information, and combining it with the original user prompt.
  4. Visual References: If images are found during the search, they are passed directly to the image generator as visual references.
  5. Image Generator: It receives the enriched prompt and visual references, attempting to generate an image that satisfies the user's request.
  6. Online DPO (Direct Preference Optimization): This is the first stage of co-training (shown at the top of the diagram). The generated image is compared with "Chosen" and "Rejected" images. This process samples search-enhanced generation results and ranks them based on quality, constructing preference pairs (e.g., the chosen image is better than the rejected image). These preference pairs are used to expand the generator's knowledge boundary outward, enabling it to generate images that better meet the requirements.
  7. Rejection Sampling Finetuning: This is the second stage of co-training (shown at the bottom of the diagram). This process recalibrates the reasoner to adapt to the enhanced generator after online DPO training. It reinforces paths that improve output through rational search while discarding those that lead to output degradation. This loop ensures the reasoner knows when and how to effectively use search to assist the generator.

Meanings of the various components and sections in the diagram:

  • Image Generator: Located in the dashed circle in the upper left, it represents the model responsible for generating images based on the prompt. Its knowledge boundary is what needs to be expanded.
  • Online DPO: The blue circular arrow to the right of the image generator indicates the first-stage training process, optimizing the generator through preference learning.
  • Chosen / Rejected: The two images to the right of Online DPO, marked with a green check and a red cross respectively, represent generated samples evaluated as good or bad during the DPO process.
  • VLM Reasoner: The dashed circle in the middle-right of the diagram represents the model responsible for understanding the user prompt, identifying knowledge gaps, and performing searches.
  • Identify Knowledge Gaps: Located below the VLM Reasoner, it signifies the step where the reasoner analyzes the user prompt and determines its knowledge limitations.
  • Image/Text Search: Located to the left of the VLM Reasoner, it represents the process of retrieving external information based on knowledge gaps.
  • Selection: Located between Image/Text Search and Visual References, it indicates the process of filtering search results.
  • Enriched Prompt: Located between Selection and the Image Generator, it represents the new prompt formed by integrating the searched information into the original prompt.
  • Visual References: Located below the Enriched Prompt, it represents images retrieved from external searches and directly provided to the image generator.
  • User Prompt: Located to the right of the VLM Reasoner, it represents the user's initial request.
  • Rejection Sampling Finetuning: The orange circular arrow below the User Prompt indicates the second-stage training process used to calibrate the reasoner.
  • Learn to Search What Generators Cannot Be Taught: The orange arrow to the right of Rejection Sampling Finetuning indicates the overall goal of the framework: to teach the reasoner to perform effective searches when the generator lacks knowledge.
  • Legend: The legend in the bottom left corner explains the symbols in the diagram:
    • Dashed circle: "Knowledge Frontier"
    • Green check: "Chosen"
    • Red cross: "Rejected"

The specific operation of the method shown in this diagram is as follows:

  1. Co-training Framework: The method employs a "teach-search" co-training framework. The first stage is "teaching" the generator, and the second stage is "calibrating" the reasoner.
  2. First Stage: Online DPO:
    • When a user makes a request, the VLM reasoner first attempts to identify knowledge gaps within it.
    • Then, the reasoner performs a search to obtain relevant information and integrates this information into the prompt, forming an enriched prompt.
    • This enriched prompt is provided to the image generator, which attempts to generate an image.
    • The Online DPO process collects these generated images and compares them with known good (chosen) and bad (rejected) image samples.
    • Through this preference learning, the generator is trained to generate images closer to the "chosen" samples, thereby expanding its knowledge boundary to handle requests it previously didn't know how to process.
  3. Second Stage: Rejection Sampling Finetuning:
    • Once the generator has been enhanced through Online DPO, the reasoner also needs to adjust its behavior accordingly.
    • The rejection sampling finetuning process re-evaluates the reasoner's decision paths. It reinforces search strategies that yield better output after the generator has been enhanced.
    • Simultaneously, it discards search strategies that lead to a decline in output quality after the generator has been enhanced.
    • This process ensures the reasoner knows when to rely on the generator's internalized knowledge and when to perform an external search.

In summary, this diagram shows an iterative optimization process: by teaching the generator to handle more types of requests to expand its knowledge boundary, then calibrating the reasoner to utilize this enhanced generator more effectively and perform external searches when necessary. This framework aims to address the limitations of visual generation models when faced with unknown or long-tail knowledge, enabling them to better meet the demands of an open world.

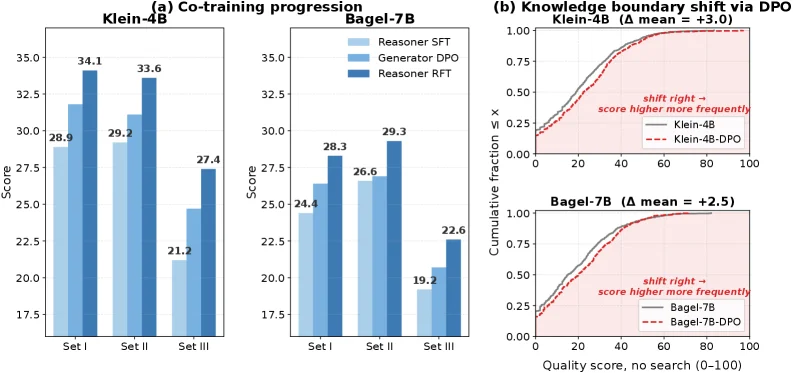
Figure 8: Co-training progression and knowledge boundary shift. (a) Grouped bars show the three co-training stages (Reasoner SFT, Generator DPO, Reasoner RFT) for Set I (easiest), Set II, and Set III (hardest) search-intensive tiers (Klein-4B). All three tiers show monotonic improvement. (b) Cumulative distribution of per-prompt no-search quality scores for base vs. DPO-finetuned generators on the 647-prompt eval set. The DPO curve sits below the base curve, indicating a rightward shift: fewer prompts receive low scores and more receive high scores from parametric knowledge alone. The shaded region represents newly internalized knowledge: concepts that previously required search but now reside in generator parameters. The shift is consistent across both Klein-4B (top) and Bagel-7B (bottom), confirming that DPO expands the knowledge boundary regardless of architecture.

This figure (Figure 8) is divided into two main parts, (a) and (b), illustrating "Co-training progression" and "Knowledge boundary shift via DPO," respectively.

First, let's look at part (a), titled "Co-training progression." This section contains two side-by-side bar charts, corresponding to the models "Klein-4B" and "Bagel-7B." Each bar chart displays the performance of three co-training stages across three different difficulty levels of search-intensive task sets (Set I, Set II, Set III).

  • X-axis: Represents the three task sets, from left to right: Set I (easiest), Set II, and Set III (hardest). This indicates that the task difficulty is increasing.
  • Y-axis: Represents "Score," ranging approximately from 17.5 to 35.0, where higher scores indicate better performance.
  • Bar colors and labels:
    • Light blue bars represent "Reasoner SFT" (Reasoner Supervised Fine-Tuning).
    • Medium blue bars represent "Generator DPO" (Generator Direct Preference Optimization).
    • Dark blue bars represent "Reasoner RFT" (Reasoner Reinforcement Fine-Tuning).
  • Data flow and information: For each task set, the three bars show the sequential performance improvements of the model as it goes through these co-training stages. For example, in Klein-4B's Set I, Reasoner SFT scores 28.9, which improves to 29.2 after Generator DPO, and further to 34.1 after Reasoner RFT. This pattern, showing "monotonic improvement" (consistently increasing scores) across all three task sets and both models, indicates that the proposed co-training framework (teach-then-search) is effective in progressively enhancing the model's performance on search-intensive tasks.

Next, part (b) is titled "Knowledge boundary shift via DPO." This section contains two cumulative distribution plots, again for models "Klein-4B" and "Bagel-7B." These plots show the cumulative distribution of per-prompt quality scores from a 647-prompt evaluation set for the baseline generator versus the DPO-finetuned generator, without using search.

  • X-axis: Represents "Quality score, no search (0-100)," meaning the quality score achieved by the generator when no external search is used, ranging from 0 to 100, where higher scores indicate better generation quality.
  • Y-axis: Represents "Cumulative fraction ≤ X," ranging from 0.00 to 1.00. This indicates the proportion of prompts that achieve a score less than or equal to X.
  • Curves:
    • The black solid line represents the baseline model (e.g., "Klein-4B" or "Bagel-7B").
    • The red dashed line represents the DPO-finetuned model (e.g., "Klein-4B-DPO" or "Bagel-7B-DPO").
  • Data flow and information: By comparing the two curves, we see that the DPO-finetuned model (red dashed line) lies above the baseline model (black solid line) for most score ranges. This means that for the same number of prompts, the DPO-finetuned model achieves higher scores. For instance, in the Klein-4B plot, the red dashed line has a higher cumulative fraction in the higher score regions (e.g., 70-100), and a lower cumulative fraction in the lower score regions (e.g., 0-30). The text annotation "shift right → score higher more frequently" explains this: the DPO curve shifting to the right indicates that the model more frequently receives higher scores. This demonstrates that DPO fine-tuning enables the generator to handle prompts better using its parametric knowledge alone, reducing reliance on external search.
  • Knowledge boundary shift: The shaded region (pink) represents "newly internalized knowledge"—concepts that previously required search but can now be retrieved directly from the generator's parameters. The rightward shift of the DPO curve signifies an expansion of the generator's knowledge boundary.
  • Comparison objects and conclusion: The plot compares the baseline model with the DPO-finetuned model. The conclusion is that, regardless of the model architecture (both Klein-4B and Bagel-7B show a consistent trend), DPO effectively expands the generator's knowledge boundary, allowing it to handle more previously unmanageable prompts without search, thus improving generation quality. The Δ mean (mean score change) is +3.0 for Klein-4B and +2.5 for Bagel-7B, quantifying this improvement.

In summary, this figure demonstrates the effectiveness of the proposed "teach-then-search" co-training framework. Part (a) shows how the method progressively improves model performance through multiple training stages, and part (b) shows how DPO expands the generator's internal knowledge, reducing reliance on external search and enhancing generation quality. Together, these parts prove the validity of the proposed approach.

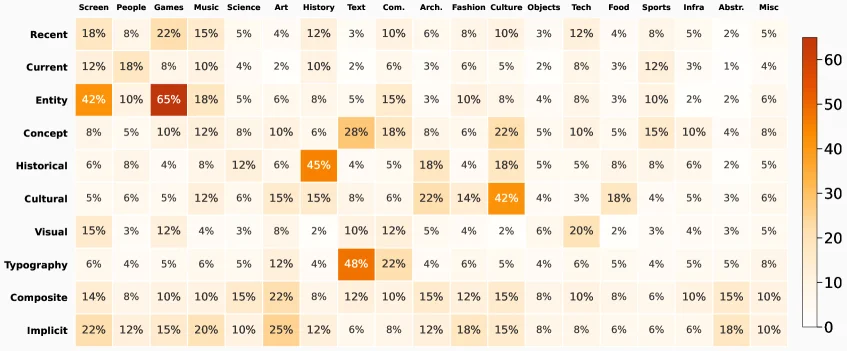
Figure 9: The bottleneck is pervasive: every domain–category combination shows knowledge-driven degradation. Heatmap summarizing cross-category structure between failure modes and domain categories in SearchGen-20K . The uniform severity across all cells rules out the hypothesis that failures concentrate in a few niche categories.

This figure (Figure 9) is a heatmap that visually demonstrates the knowledge - driven degradation of visual generation models across different domain - category combinations. Here is a detailed interpretation:

Components of the Figure and Information Flow

  1. Axes:

    • Y - axis (Rows): It represents different "failure modes" or "request types". From top to bottom, they are: Recent, Current, Entity, Concept, Historical, Cultural, Visual, Typography, Composite, Implicit. These rows indicate the different natures of user requests or the dimensions in which the model may fail.
    • X - axis (Columns): It represents different "domain categories". From left to right, they are: Screen, People, Games, Music, Science, Art, History, Text, Com., Arch., Fashion, Culture, Objects, Tech, Food, Sports, Infras., Abstr., Misc. These columns represent different thematic domains.
  2. Color Coding:

    • The heatmap uses a color gradient to represent the magnitude of values. The color bar on the right shows that the color ranges from light yellow (close to 0) to dark orange (close to 60). The larger the value, the darker the color. Here, the value may represent a certain "degree of degradation" or "severity of knowledge gap", and a higher value means that the model performs worse (that is, the knowledge - driven degradation is more serious) in the corresponding domain - category combination.
  3. Data Cells:

    • Each cell corresponds to a specific combination of "failure mode (row)" and "domain category (column)". The number and color in the cell represent the degree of knowledge - driven degradation in that combination. For example, the cell at the intersection of the "Entity" row (entity) and the "Games" column (games) has the darkest color (with a value of 65%), which means that in the "entity" - type requests, the knowledge - driven degradation in the "games" domain is the most serious.

How the Method Works (Inferred from the Figure)

This figure is part of the research on the "knowledge - driven bottleneck of visual generation". The background of the research is that visual generation models perform well within the scope of training data, but they will confidently fabricate wrong content for new knowledge beyond the training data (such as new characters, trendy entities, post - cutoff events, etc.). To study this problem, researchers constructed the SearchGen - 20K dataset, which contains 20,839 prompts spanning 12 failure categories and 22 domains, and paired it with a pre - executed multimodal SearchGen - Corpus - 1M to support offline and reproducible research.

The role of this figure is to visually display the knowledge - driven degradation across different domain - category combinations to verify the hypothesis that "the bottleneck is pervasive". Specifically:

  • Analyze the degradation of domain - category combinations: By observing the color and value of each cell, researchers can determine which domain - category combinations are the most challenging for the model. For example, the "Entity" (entity) category has relatively high degradation values in multiple domains (such as Games, Culture, Objects, etc.), while the "Implicit" (implicit) category also has relatively high values in domains such as "Art", "History", "Abstr.".
  • Verify the universality of the bottleneck: The figure shows that almost all cells have a certain degree of degradation (the color is not light yellow), which indicates that the knowledge - driven degradation is not concentrated in a few niche categories, but is universally present in all domain - category combinations. This is consistent with the conclusion in the figure caption: "the uniform severity across all cells rules out the hypothesis that failures concentrate in a few niche categories".

Interpretation of the Results (Coordinates, Comparison Objects, and Conclusions)

  • Coordinates: The X - axis is the domain category, and the Y - axis is the failure mode. The coordinates (row, column) of each cell correspond to a specific combination of failure mode and domain category.
  • Comparison Objects: It is the comparison of the degree of degradation between different domain - category combinations. By comparing the colors and values of different cells, we can see which combinations have more serious degradation.
  • Conclusions:
    • All domain - category combinations show knowledge - driven degradation (that is, no cell has a color close to light yellow with a value close to 0), which indicates that the bottleneck is universal rather than concentrated in a few categories.
    • Different failure modes and domain categories have different degrees of degradation. For example, the "Entity" category has the most serious degradation in the "Games" domain (65%), while the "Typography" category has relatively low degradation in most domains.
    • This universal degradation verifies the hypothesis of the research, that is, the knowledge bottleneck of visual generation models is structural and needs to be solved by search tools and co - training frameworks.

In summary, this heatmap, by visualizing the knowledge - driven degradation across different domains and failure categories, clearly shows that the knowledge bottleneck of visual generation models is universal rather than limited to a few niche categories. This provides important visual evidence for subsequent research on how to solve this bottleneck through search tools and co - training frameworks.

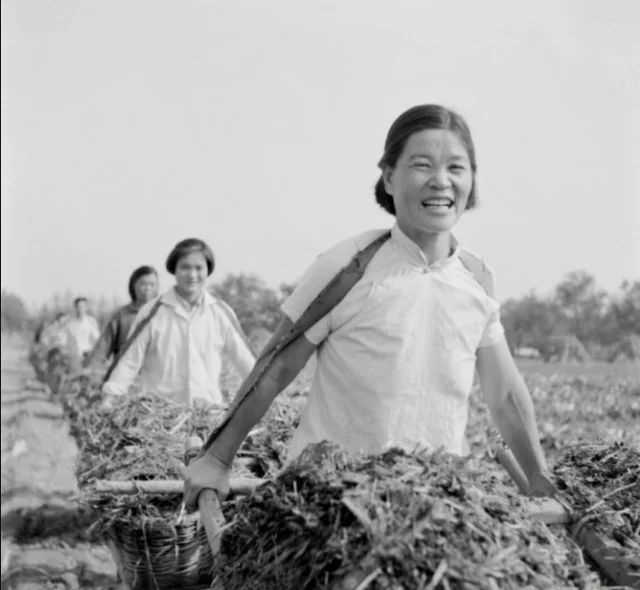
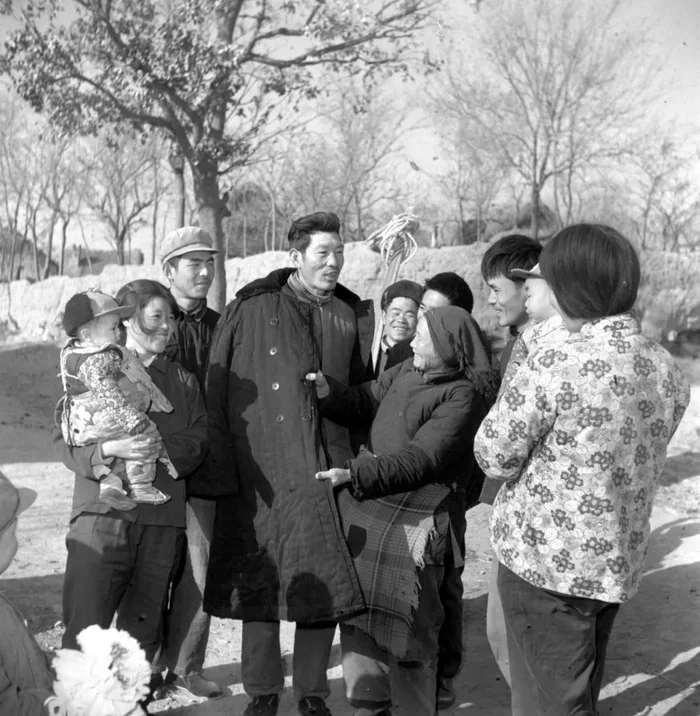
Figure 10: The end-to-end example’s visual output. The three references the reasoner retrieved and selected (top: scene, costume, likeness) and the image the generator produced from the enriched prompt (bottom), for the Yang Chaoyue request traced in the box above. This is the section’s only image example; it grounds what “retrieved references” and “generation” concretely look like. The per-stage boxes that follow are text-only and use different prompts, each chosen to isolate one stage’s behavior.

This figure (Figure 10) is the core diagram in the paper showcasing "end-to-end example visual output," used to intuitively explain the specific forms of "retrieval reference" and "image generation" in the method. We break it down with the following logic:

Components and Information Flow

  • Top Region (Implied "Retrieval Reference" Section): According to the caption, this area was originally intended to display three references (related to scene, clothing, and portrait) retrieved and selected by the reasoner. However, what's actually shown in the image appears to be the final generated image? Perhaps the "top" part described in the caption is presented as the generated image in the figure? Or maybe the generated image is shown, while the "top" references are simplified in the layout? Combining the caption, the actual image displays the image generated by the generator from the "enriched prompt" (the main/bottom image shown), and the "retrieved references" (scene, clothing, portrait) are intermediate steps (textual prompt optimization) in the method. The figure reflects the result of integrating these references through the final generated image.
  • Image Content: The image shows a scene of a woman (the generation result for a request related to Yang Chaoyue) working in a field, pushing a tool loaded with hay, with others behind her. This image is generated by the generator based on the "enriched prompt" (i.e., the prompt combined with retrieved reference information), demonstrating the result of the "generation" phase in the method.
  • Information Flow Order: The method's process is: First, for the request related to "Yang Chaoyue," the reasoner retrieves and selects three references (scene, clothing, portrait); then, the information from these references is integrated into the prompt (enriching the prompt); finally, the generator generates an image based on this enriched prompt (the image shown in the figure). What the figure directly presents is the output of the generation phase, while "retrieval reference" is a previous textual phase step (the specific content of the references is not directly shown in the figure, only their effect is reflected through the generated image).

Intuitive Explanation of Method Operation

This figure demonstrates an end-to-end example of the "agentic visual generation" method in the paper: 1. Request Handling: For a specific request (here, a visual generation request related to "Yang Chaoyue"), the method first uses the reasoner to retrieve relevant references (scene, clothing, portrait, etc.). These references help clarify the details of the generated content (such as the character's clothing style, scene type, portrait features, etc.). 2. Prompt Enrichment: The information from the retrieved references is integrated into the original prompt to form an "enriched prompt." This prompt contains more constraints and details about the generated content, solving the problem that the generator cannot generate accurately due to limitations in training data. 3. Image Generation: The generator generates an image based on this enriched prompt (the image shown in the figure). This image integrates the retrieved reference information (scene, clothing, portrait), demonstrating how the method, through the "retrieval + generation" process, overcomes the generator's knowledge boundaries to generate an image that matches the request.

Results and Conclusions (Inferred from the Figure)

  • This figure is an example of the method's effectiveness: It shows that through the process of "retrieving references (scene, clothing, portrait) + generation," the generator can produce an image that matches a specific request (related to Yang Chaoyue). Details in the image, such as the character's clothing and the scene (working in the field), reflect that the retrieved references are integrated into the generation result, proving that the method can solve the problem of the generator "confidently fabricating unknown content" by retrieving external references to enrich the prompt, thus generating a more accurate image.
  • Comparison Object: Compared to the performance of generators in existing benchmarks (e.g., frontier generators in SearchGen - Bench score only 21 - 28/100), the method shown in this figure (through retrieval + generation) can generate an image that better matches the request, indicating that the method can improve the generator's performance on world - knowledge - grounded requests.
  • Conclusion: This figure intuitively demonstrates the core logic of the method in the paper—through the "teach - then - search" collaborative training framework (or here, the "retrieval reference + generation" process), discover the generator's knowledge boundaries and use search tools (retrieval references) to expand the generator's capabilities, thus generating an image that matches open - world requests. Even the minimum version of the collaborative training recipe can produce monotonic improvements, laying the foundation for recursive self - improvement in visual generation.

(Note: What is actually shown in the figure is the generated image, and "retrieved references" are intermediate textual steps in the method. The figure reflects the role of these references through the generated image. The specific content of the "retrieved references" that cannot be seen clearly in the figure is understood according to the caption as being related to scene, clothing, and portrait, used to enrich the prompt to guide generation.)

Figure 10: The end-to-end example’s visual output. The three references the reasoner retrieved and selected (top: scene, costume, likeness) and the image the generator produced from the enriched prompt (bottom), for the Yang Chaoyue request traced in the box above. This is the section’s only image example; it grounds what “retrieved references” and “generation” concretely look like. The per-stage boxes that follow are text-only and use different prompts, each chosen to isolate one stage’s behavior.

This figure (Figure 10) represents the visual output of an end-to-end example from the paper, clearly illustrating what "retrieved references" and "generated image" specifically look like. It is the only image example in this section, with subsequent stage boxes containing text-only content, each using different prompts to isolate the behavior of each stage.

First, let's understand the various components of the image and the flow of information:

  1. Top Section: Retrieved References:

    • The image shows a group of people in an outdoor setting. This set of images (possibly multiple, but one main scene is displayed here) represents the three references that the "reasoner" (reasoner) has retrieved and selected from an external knowledge source (such as SearchGen-Corpus-1M).
    • According to the caption, these references were chosen based on their relevance to "scene," "costume," and "likeness." This implies that the reasoner analyzes the user request (in this example, a request related to "Yang Chaoyue," although the people in the image are not Yang Chaoyue themselves but serve as an example scenario), and then finds images from the database that match the key elements of the request.
    • The information flow at this point is the "input" stage: User Request -> Reasoner Analysis -> Retrieve and Select Relevant Reference Images.
  2. Bottom Section: Generated Image:

    • Although this figure itself only displays the top reference image, according to the caption, the "bottom" of this figure (Figure 10) should show the final image generated by the visual generator (generator) based on an "enriched prompt."
    • This "enriched prompt" is formed by combining the original user request with information extracted from the retrieved reference images (such as scene details, costume styles, character features, etc.).
    • The information flow at this point is the "processing" and "output" stage: Retrieved References -> Enriched Prompt -> Generator Produces Image.

This figure reveals how the method proposed in the paper, under the "teach-then-search" co-training framework, specifically operates:

  • Core Idea: To address the "world knowledge bottleneck" issue faced by visual generators when dealing with unknown or long-tail knowledge. The knowledge learned by the generator through training is limited, while the external world is constantly evolving. Therefore, it is necessary to combine external search tools to enhance generative capabilities.
  • Methodology Flow:
    1. Search: When a user request is received, the system first uses a reasoner to retrieve reference images related to the request from an external knowledge base (e.g., SearchGen-Corpus-1M). These reference images provide specific visual information that the generator might not know or find difficult to learn from its training data (such as specific scenes, clothing styles, or character appearances).
    2. Select: The reasoner not only retrieves images but also selects the most relevant and useful ones. As in this example, references related to "scene," "costume," and "likeness" are selected.
    3. Enrich Prompt: Key information from the retrieved reference images (such as scene details, clothing styles, character features, etc.) is extracted and integrated into the original user request to form a richer and more specific prompt.
    4. Generate: The visual generator uses this enriched prompt to generate the final image. Thus, the generated image combines the generator's existing knowledge with new knowledge retrieved from the outside, enabling it to better meet user requests for long-tail or unknown knowledge.
  • Purpose: Through this approach, the system can leverage external knowledge to compensate for the generator's internal knowledge limitations, achieving more accurate and user-desired visual generation.

Although this figure itself does not have coordinates, comparison objects, or explicit numerical conclusions (it is a qualitative example), it intuitively demonstrates the core steps of the proposed method:

  • Comparison Objects: The implicit comparison objects are "generation using only the original prompt" versus "generation after enriching the prompt with retrieved reference information." The former might fail to accurately capture all details of the request (especially long-tail or unknown knowledge), while the latter improves generation accuracy and relevance by introducing external references.
  • Conclusion: This figure, as a concrete example, proves that the proposed method (i.e., the "teach-then-search" framework combining retrieval and generation) is feasible and can effectively integrate external knowledge into the visual generation process. It shows what "retrieved references" look like and how the "generated image" is produced based on these references and the enriched prompt. Even a minimal version of this co-training method produces monotonic improvements, laying the foundation for recursive self-improvement in visual generation.

In summary, this figure visually explains the two key steps ("retrieving references" and "generating image") through a specific example (a request related to "Yang Chaoyue"), clearly illustrating how the method proposed in the paper overcomes the knowledge bottleneck of visual generators by combining external search and generation.

Figure 10: The end-to-end example’s visual output. The three references the reasoner retrieved and selected (top: scene, costume, likeness) and the image the generator produced from the enriched prompt (bottom), for the Yang Chaoyue request traced in the box above. This is the section’s only image example; it grounds what “retrieved references” and “generation” concretely look like. The per-stage boxes that follow are text-only and use different prompts, each chosen to isolate one stage’s behavior.

This figure (Figure 10) is the end - to - end visual output example in the paper, used to intuitively demonstrate the complete process of "retrieving references + generating images" and to explain how the method meets world - knowledge - driven visual generation requests (taking the "Yang Chaoyue" request as an example). Here is a detailed breakdown:

1. Components and Information Flow

  • Upper Part (Implied "Retrieval References" Area): According to the caption, this part contains three references retrieved and selected by the reasoner, corresponding to "scene", "costume", and "likeness" respectively. Although only the final generated image is shown in the figure, logically, these three references are the prior input for generation: the reasoner retrieves references related to the "Yang Chaoyue" request from external resources (such as SearchGen - Corpus - 1M), and selects the most relevant ones as the contextual basis for generation.
  • Lower Part (Generated Image): The image shown in the figure is the final image generated by the generator based on the "enriched prompt" (that is, the prompt integrated with the original request and the retrieved reference information). The content of the image is: a person (Yang Chaoyue) is wearing a light - colored hooded coat (with green details), a light green inner garment, and the same - colored shorts/skirt. The background is an outdoor scene with flowers, grass, and a stream, and she is holding a small flower. These elements (scene, costume, likeness) correspond one - to - one with the categories of "retrieval references" (scene/costume/likeness), verifying the effectiveness of the method.

2. Visualization of Method Operation

This figure visually explains the core logic of the "retrieval - generation" framework through a "single example": - Step 1: Request and Retrieval: For the visual generation request of "Yang Chaoyue" (which belongs to a long - tailed/unknown request in the "world knowledge bottleneck" and is not sufficiently covered by the training data), the reasoner retrieves references related to the request from the external corpus (such as SearchGen - Corpus - 1M), solving the problem that "the generator's training data is insufficient to handle new entities/scenes independently". - Step 2: Reference Selection and Prompt Enrichment: The reasoner selects the three most relevant references (scene/costume/likeness) from the retrieval results and integrates the information of these references into the original prompt to form an "enriched prompt" (that is, a prompt containing clear constraints on scene, costume, and likeness). - Step 3: Generation Verification: The generator generates an image based on the "enriched prompt", and the image shown in the figure is the output of this process. By comparing the "categories of retrieval references" and the "elements of the generated image", it can be intuitively seen that: the generated scene (flowers, grass, and stream), costume (light - colored coat with green details), and likeness (features of Yang Chaoyue) all match the reference categories, proving that the "retrieval - generation" framework can effectively use external knowledge to make up for the knowledge boundary of the generator.

3. Results and Conclusions (Inferred from the Figure)

  • Comparison Objects: This figure is an end - to - end example of "retrieving references + generating images". It is compared with "generating only with the original prompt" (which will fail due to lack of knowledge, such as the low scores of frontier generators in existing benchmarks) and "generating after retrieval" (which can accurately restore the details of the request).
  • Conclusion: The generated image in the figure accurately presents the likeness of "Yang Chaoyue", and the scene and costume meet the requirements, indicating that the "retrieval - generation" framework (especially the "teach - then - search" collaborative training) can effectively break through the knowledge boundary of the generator and meet world - knowledge - driven visual generation requests. This is the only image example in this part of the paper. The subsequent stage analyses are in text form, which are used to isolate the behavior of each stage, but this figure intuitively verifies the core logic of the method: by retrieving external knowledge (scene, costume, likeness) and integrating it into the prompt, the generator can generate images that meet long - tailed/unknown requests.

In short, this figure uses a specific "Yang Chaoyue" request case to show the complete process from "retrieving references" to "generating images", proving how the method can handle requests that the generator could not handle originally by supplementing external knowledge.

Figure 10: The end-to-end example’s visual output. The three references the reasoner retrieved and selected (top: scene, costume, likeness) and the image the generator produced from the enriched prompt (bottom), for the Yang Chaoyue request traced in the box above. This is the section’s only image example; it grounds what “retrieved references” and “generation” concretely look like. The per-stage boxes that follow are text-only and use different prompts, each chosen to isolate one stage’s behavior.

This figure (Figure 10) from the paper illustrates an end-to-end example of visual output. The image shows the final generated result for the request "Yang Chaoyue": the main subject is a person standing on a path in a wheat field, holding a shovel, with two thatched cottages and distant scenery in the background. Overall, elements such as the scene, character's clothing style, and visual features correspond to the three references (scene, costume, and likeness, as noted at the top) retrieved and selected by the reasoner. These references were filtered from the retrieved content, used to enrich the prompt, and then the generator produced this image based on the enhanced prompt (with the generation process explained at the bottom). From a methodological perspective, this demonstrates the "retrieve references → enrich prompt → generate image" workflow: first, the reasoner retrieves relevant references (e.g., scene, costume, likeness), selects appropriate ones to supplement the original prompt, creating a richer and more targeted prompt, and finally, the generator produces the corresponding visual content based on this enriched prompt. As the only graphical example in this section, the figure concretely presents what "retrieved references" and "generated results" look like in practice, helping readers intuitively understand these two components of the method. Subsequent phase boxes are purely textual, using different prompts to separate each stage's actions, but this figure focuses on the final visual output, illustrating how the method processes requests like "Yang Chaoyue" by retrieving references and generating corresponding images.

← → flip · ↑ ↓ scroll notes · Esc exit