🌊 Tide

Information moves like the tide. We pick the waves worth studying.

中文

← Today's tide

Published 2026-07-14 · Alibaba AMAP CV Lab · Ruiyan Gong, Yingnan Guo, Junjun Hu et al.

ABot-N1: Toward a General Visual Language Navigation Foundation Model

arXiv · HuggingFace · ▲101

Abstract (verbatim)

Visual Language Navigation foundation models aim to unify deep reasoning for grounded spatial decisions with broad versatility for diverse embodied tasks. Current approaches typically achieve this integration via monolithic policies that map observations directly to actions, yet they often suffer from coordinate drift and poor handling of long-tail semantics. Furthermore, these black-box mappings lack interpretability, hindering the simultaneous achievement of generality, robustness, and transparency. We present ABot-N1, a step toward a general Visual Language Navigation foundation model, that addresses these challenges by decoupling cognition from control via a slow-fast architecture guided by dual visual-language signals. More specifically, a slow vision-language reasoner performs explicit Chain-of-Thought reasoning while producing a pixel goal. This compact set of image-space anchor points serves as a universal interface for diverse tasks, including point-goal, object-goal, poi-goal, instruction-following, and person-following. Subsequently, a fast action expert leverages both the textual cues and the pixel guidance to generate continuous waypoints at the native control frequency. By bridging high-level intents and low-level control through pixel-grounded anchors paired with explicit linguistic traces, our approach ensures robust, generalizable, and interpretable navigation across simulation and real-world benchmarks. ABot-N1 establishes new state-of-the-art records, delivering massive gains specifically in urban-scale navigation: boosting POI arrival by 35.0% (to 77.3%) and achieving 95.4%/92.9% SR in complex indoor and outdoor scenes. It also maintains superior robustness across object-reaching, person-following, and instruction-following tasks. New Point-Goal/POI-Goal benchmarks are released as open source to advance the field of urban-scale navigation.

Background

Background Analysis

1. Technical Context
Visual Language Navigation (VLN) technologies aim to enable robots or agents to navigate autonomously in complex environments by combining visual observations with language instructions. These technologies address real-world challenges such as urban navigation (e.g., finding a "café" via natural language), precise point-goal reaching in indoor settings, or tracking moving people. Key requirements include spatial localization, open-vocabulary semantic understanding (e.g., recognizing unseen objects), dynamic environment adaptation, and safe, interpretable behavior.

2. Previous Limitations
Traditional approaches rely on "monolithic policies" that directly map visual inputs to actions, facing three critical issues:
- Coordinate Drift and Semantic Gaps: Local coordinate-based targets (e.g., "move 5 meters forward") may point to infeasible areas (e.g., roads or flowerbeds) due to localization errors, while end-to-end training degrades pre-trained semantic knowledge (e.g., recognizing novel objects).
- Lack of Interpretability: Black-box models fail to provide decision traces, making failure analysis difficult (e.g., distinguishing between perception and reasoning errors).
- Task Fragmentation: Different navigation tasks (e.g., point-goal, object search) use isolated architectures and datasets, limiting cross-task transferability.

3. Proposed Solution
The paper introduces ABot-N1, addressing these issues with a slow-fast architecture and a pixel-goal interface:
- Slow System (Cognitive Module): A 4B-parameter multimodal model (VLM) performs high-level reasoning, generating natural language explanations (Chain-of-Thought) and a "pixel goal" (e.g., anchor regions in an image). This step grounds language instructions to visual entities while ensuring semantic validity.
- Fast System (Control Module): A 2B-parameter expert model synthesizes the slow system’s output and real-time visuals to produce continuous movement paths. This separation optimizes semantic reasoning (slow) and reactive control (fast) independently.
- Unified Interface: All tasks (e.g., point-goal, object search) are decomposed into "tracking language-explained pixel goals," enabling cross-task generality.

4. Key Differences
Compared to prior work, ABot-N1’s innovations lie in:
- Decoupling Cognition and Control: The slow-fast architecture resolves dynamic mismatches between slow semantic reasoning and fast motor control.
- Explicit Interpretability: Pixel goals and natural language explanations provide transparency for debugging and safety verification.
- Data-Driven Scalability: Pixel-level supervision and reinforcement learning enhance robustness in open worlds, moving beyond static labeled data.

This design achieves state-of-the-art performance in complex urban navigation while providing a scalable framework for future research.
Method, Figure by Figure

M E T H O D1 / 14

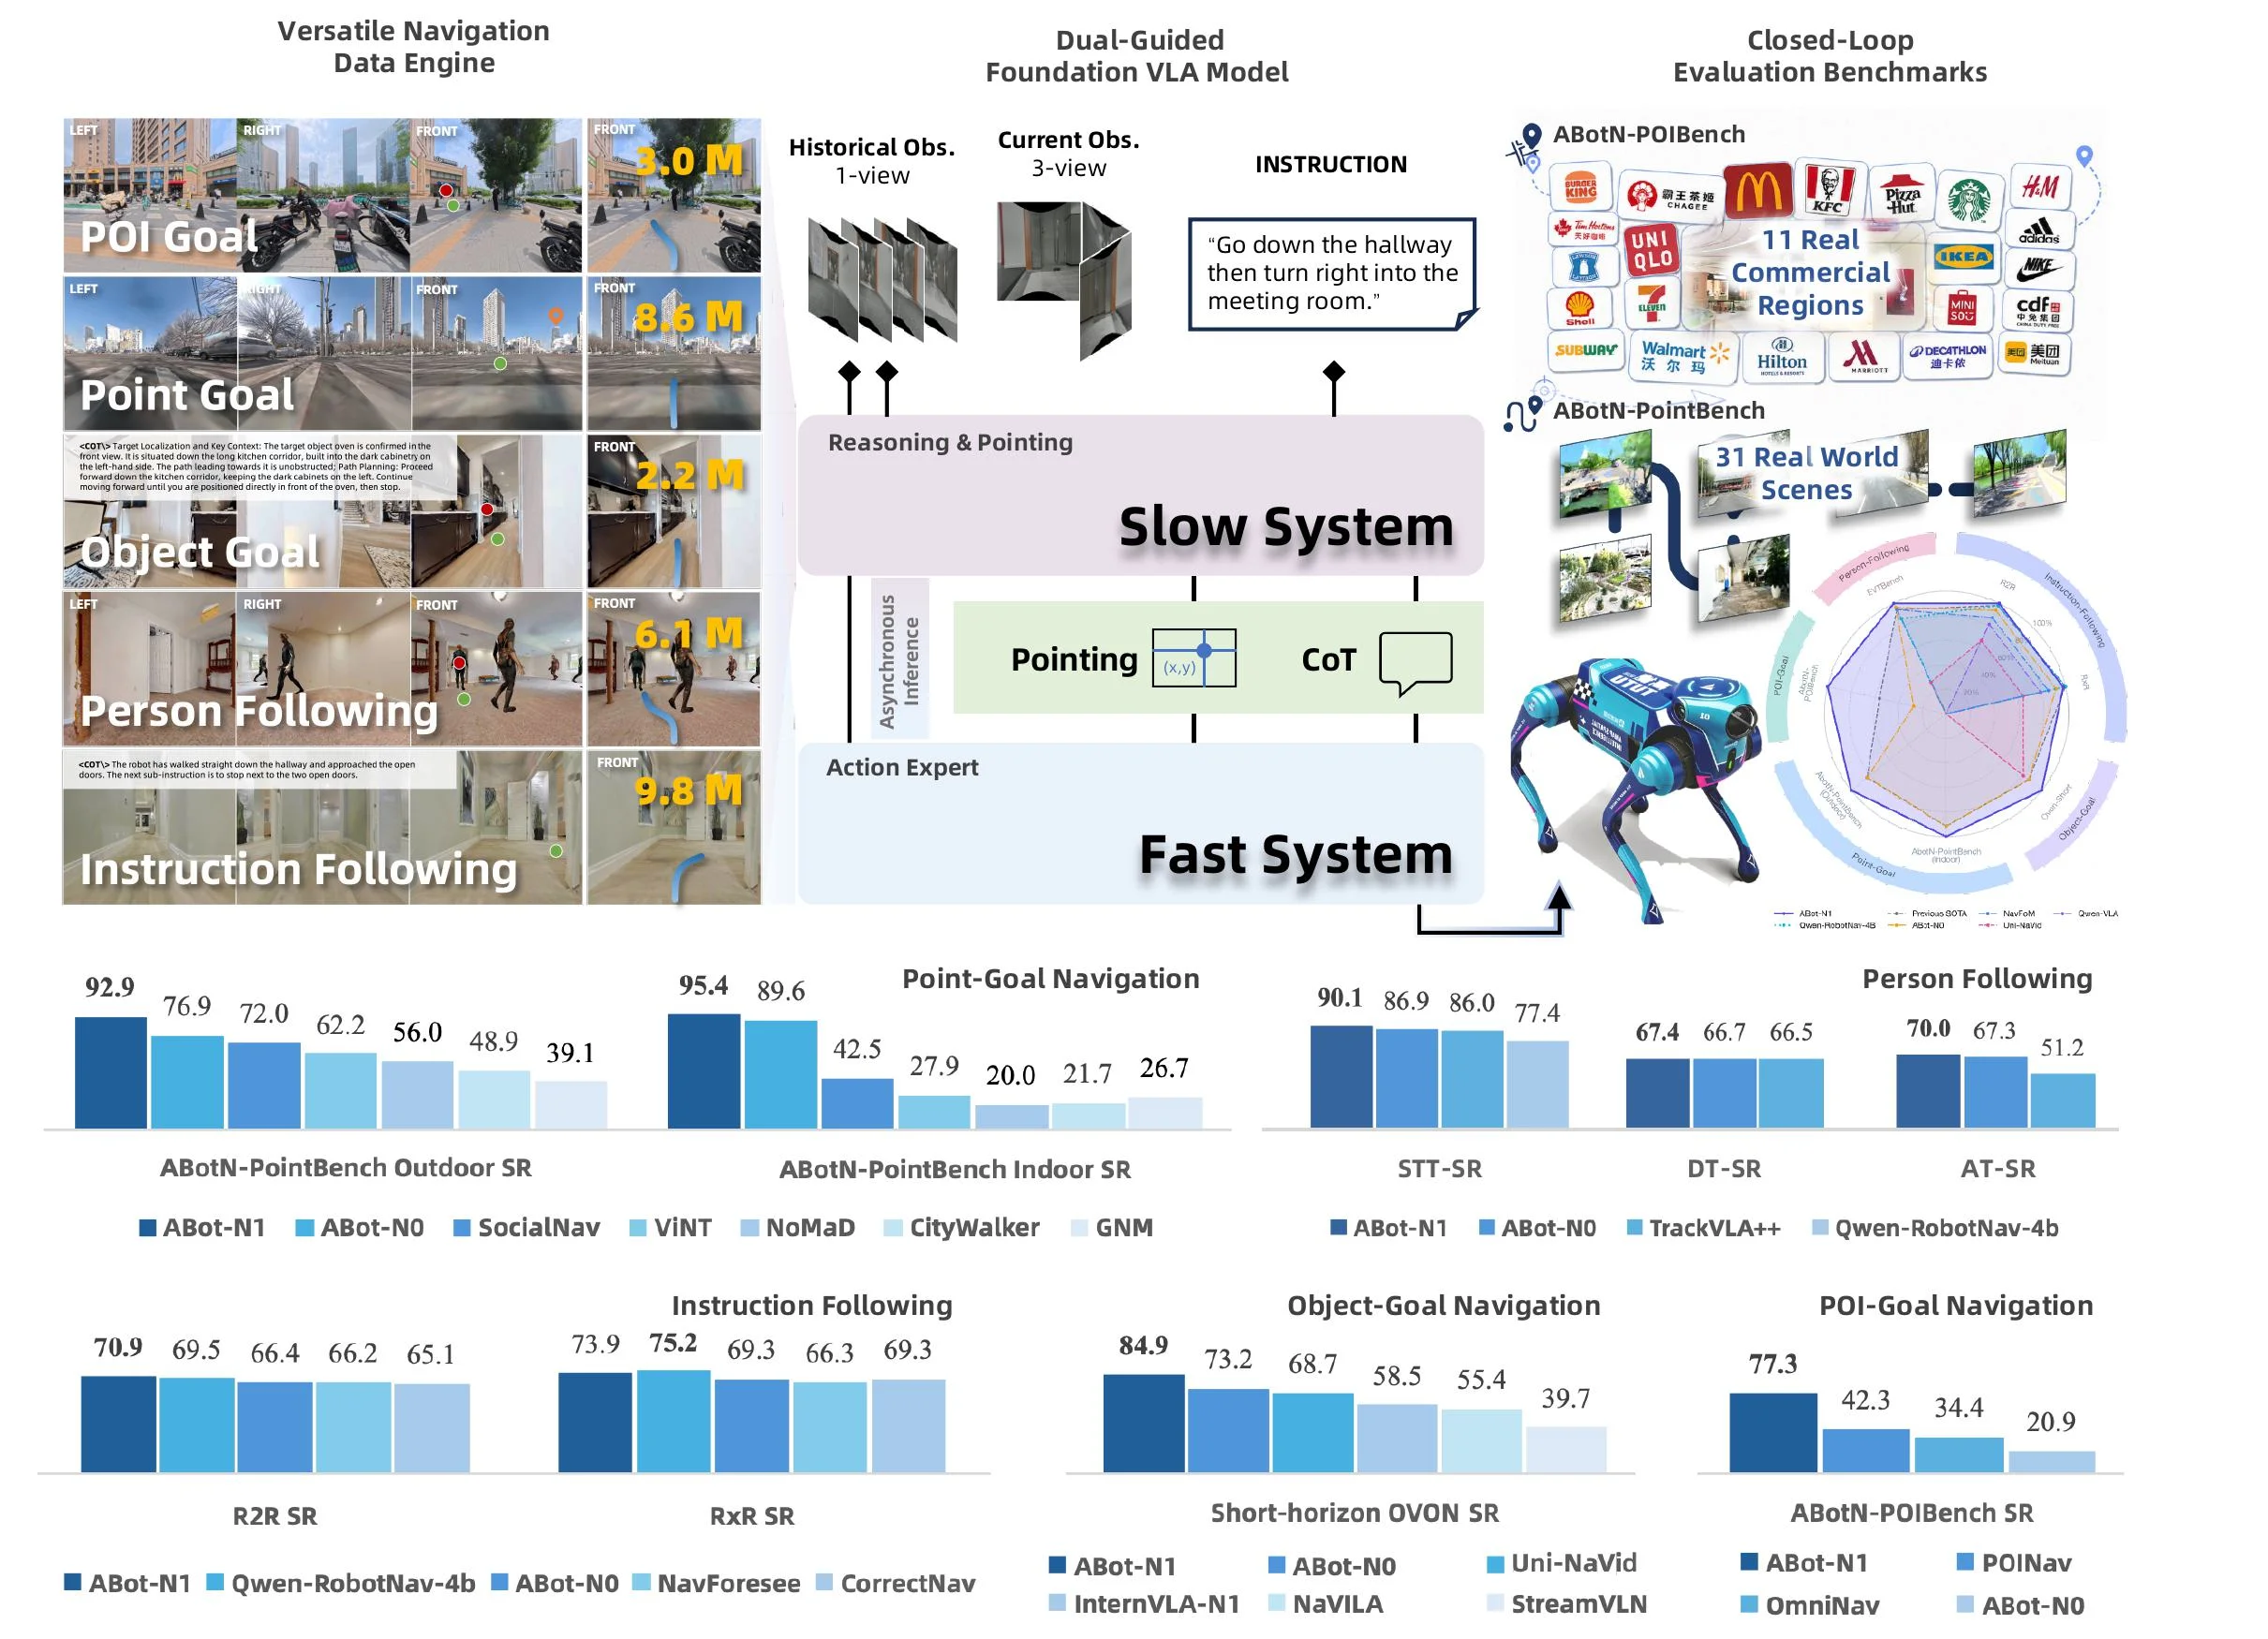
Figure 1 : Overview of ABot-N1. The model trained on 30M samples across five tasks adopts a slow–fast control architecture: a slow system performs CoT reasoning and emits pixel goals, while a fast action expert consumes this dual language-and-vision guidance to execute safe waypoints. Closed-loop evaluation is conducted on our newly proposed ABotN-PointBench and ABotN-POIBench, together with three established benchmarks (VLN-CE R2R/RxR, Short-Horizon OVON, and EVT-Bench). ABot-N1 achieves leading performance across all 5 benchmarks.

This figure, titled "Overview of ABot-N1" from the paper "ABot-N1: Toward a General Visual Language Navigation Foundation Model," provides a comprehensive visual summary of the ABot-N1 model's architecture, training data, workflow, and evaluation results.

Starting from the top-left, the "Versatile Navigation Data Engine" section illustrates the five types of navigation tasks used to train the model, along with their respective dataset sizes: * POI Goal (Point of Interest Goal): Trained on 3.0M samples, involving navigation to a specific point of interest from multi-view (left, right, front) observations. * Point Goal: Trained on 8.6M samples, focusing on navigating to a specific point, also using multi-view inputs. * Object Goal: Trained on 2.2M samples, where the agent navigates to a target object within a scene. * Person Following: Trained on 6.1M samples, tasking the agent to follow a person. * Instruction Following: Trained on 9.8M samples, which typically involves following natural language instructions. These tasks collectively provide a diverse training set aimed at endowing the model with broad adaptability.

The central upper portion of the figure, titled "Dual-Guided Foundation VLA Model," depicts the core "slow-fast" control architecture of ABot-N1: * Slow System: This component receives "Historical Obs. (1-view)" (previous single-view observations) and "Current Obs. (3-view)" (current three-view observations), along with an "INSTRUCTION." It performs "Reasoning & Pointing," which includes: * Asynchronous Inference: Suggesting that reasoning might occur asynchronously with respect to fast-control loops. * Pointing: Generates a pixel-level goal (represented as (x,y) coordinates), serving as an image-space anchor. * CoT (Chain-of-Thought): The model engages in explicit Chain-of-Thought reasoning to explain its decisions. The slow system is responsible for high-level cognition and planning, generating a compact image-space anchor that acts as a universal interface for various tasks. * Fast System (Action Expert): This component, labeled as "Action Expert," takes the "Pointing" (pixel goal) and "CoT" (reasoning information) from the slow system as input. Its role is to "leverage both the textual cues and the pixel guidance to generate continuous waypoints at the native control frequency," meaning it handles low-level, real-time action execution based on high-level guidance.

The flow of data/information is as follows: Training data (top-left) is used to train the entire model. During inference, environmental observations (historical and current) and instructions are fed into the slow system. The slow system performs reasoning and generates a pixel goal and CoT traces, which are then passed to the fast system. The fast system ultimately generates control signals for navigation.

The top-right section, "Closed-Loop Evaluation Benchmarks," shows the benchmarks used to evaluate the model: * ABotN-POIBench: Contains "11 Real Commercial Regions," featuring commercial logos like McDonald's, IKEA, and Starbucks, indicating real-world and diverse evaluation scenarios. * ABotN-PointBench: Includes "31 Real World Scenes" and depicts a robot (resembling a Boston Dynamics Spot) navigating these scenes. A radar chart next to it likely visualizes model performance across different evaluation dimensions. These benchmarks are used for closed-loop evaluation, where the model must complete navigation tasks in real or simulated environments, and its success rate, among other metrics, is assessed.

The bottom portion of the figure consists of bar charts presenting evaluation results for various tasks and benchmarks: * ABotN-PointBench Outdoor SR (Success Rate): Compares models like ABot-N1, ABot-N0, SocialNav, ViNT, NoMaD, CityWalker, and GNM on outdoor point-goal navigation. ABot-N1 (dark blue) performs best with a score of 92.9. * ABotN-PointBench Indoor SR: Compares similar models on indoor point-goal navigation. ABot-N1 scores 95.4, again the best. * STT-SR, DT-SR, AT-SR: These likely represent different types of success rates (e.g., Speech-to-Text SR, Dialogue Turn SR, Action Turn SR). For instance, STT-SR compares ABot-N1, ABot-N0, and TrackVLA++. ABot-N1 scores 90.1 in STT-SR. * Person Following: Compares models on the person-following task. ABot-N1 scores 70.0. * R2R SR (Room-to-Room SR) and RxR SR (Round-trip Room SR): These are established VLN benchmarks (e.g., VLN-CE R2R/RxR). ABot-N1 scores 70.9 on R2R SR and 73.9 on RxR SR. * Instruction Following: Compares models on instruction-following tasks. ABot-N1 scores 73.9. * Object-Goal Navigation: Compares models on object-goal navigation. ABot-N1 scores 84.9. * Short-horizon OVON SR (Short-horizon Object Visual-Observation Navigation SR): Compares models on short-horizon object visual observation navigation. ABot-N1 scores 73.2. * POI-Goal Navigation: Compares models on POI-goal navigation. ABot-N1 scores 77.3.

These results indicate that ABot-N1 achieves state-of-the-art performance across all showcased benchmarks, validating the effectiveness of its approach. The original caption states that the model is trained on 30M samples across five tasks, adopts a slow-fast control architecture guided by dual visual-language signals, undergoes closed-loop evaluation on new ABotN-PointBench and ABotN-POIBench benchmarks as well as three established ones (VLN-CE R2R/RxR, Short-Horizon OVON, and EVT-Bench), and achieves leading performance. Our explanation aligns with this information and provides a more detailed interpretation of the figure's components and workflow.

In summary, this figure clearly demonstrates ABot-N1's design: a slow system for high-level visual-language reasoning and goal generation (pixel-level), followed by a fast system that executes actions based on these high-level guidances and textual cues. This architecture aims to address issues like coordinate drift and poor handling of long-tail semantics in existing methods, while also improving interpretability. The evaluation results prove the effectiveness and superiority of this method.

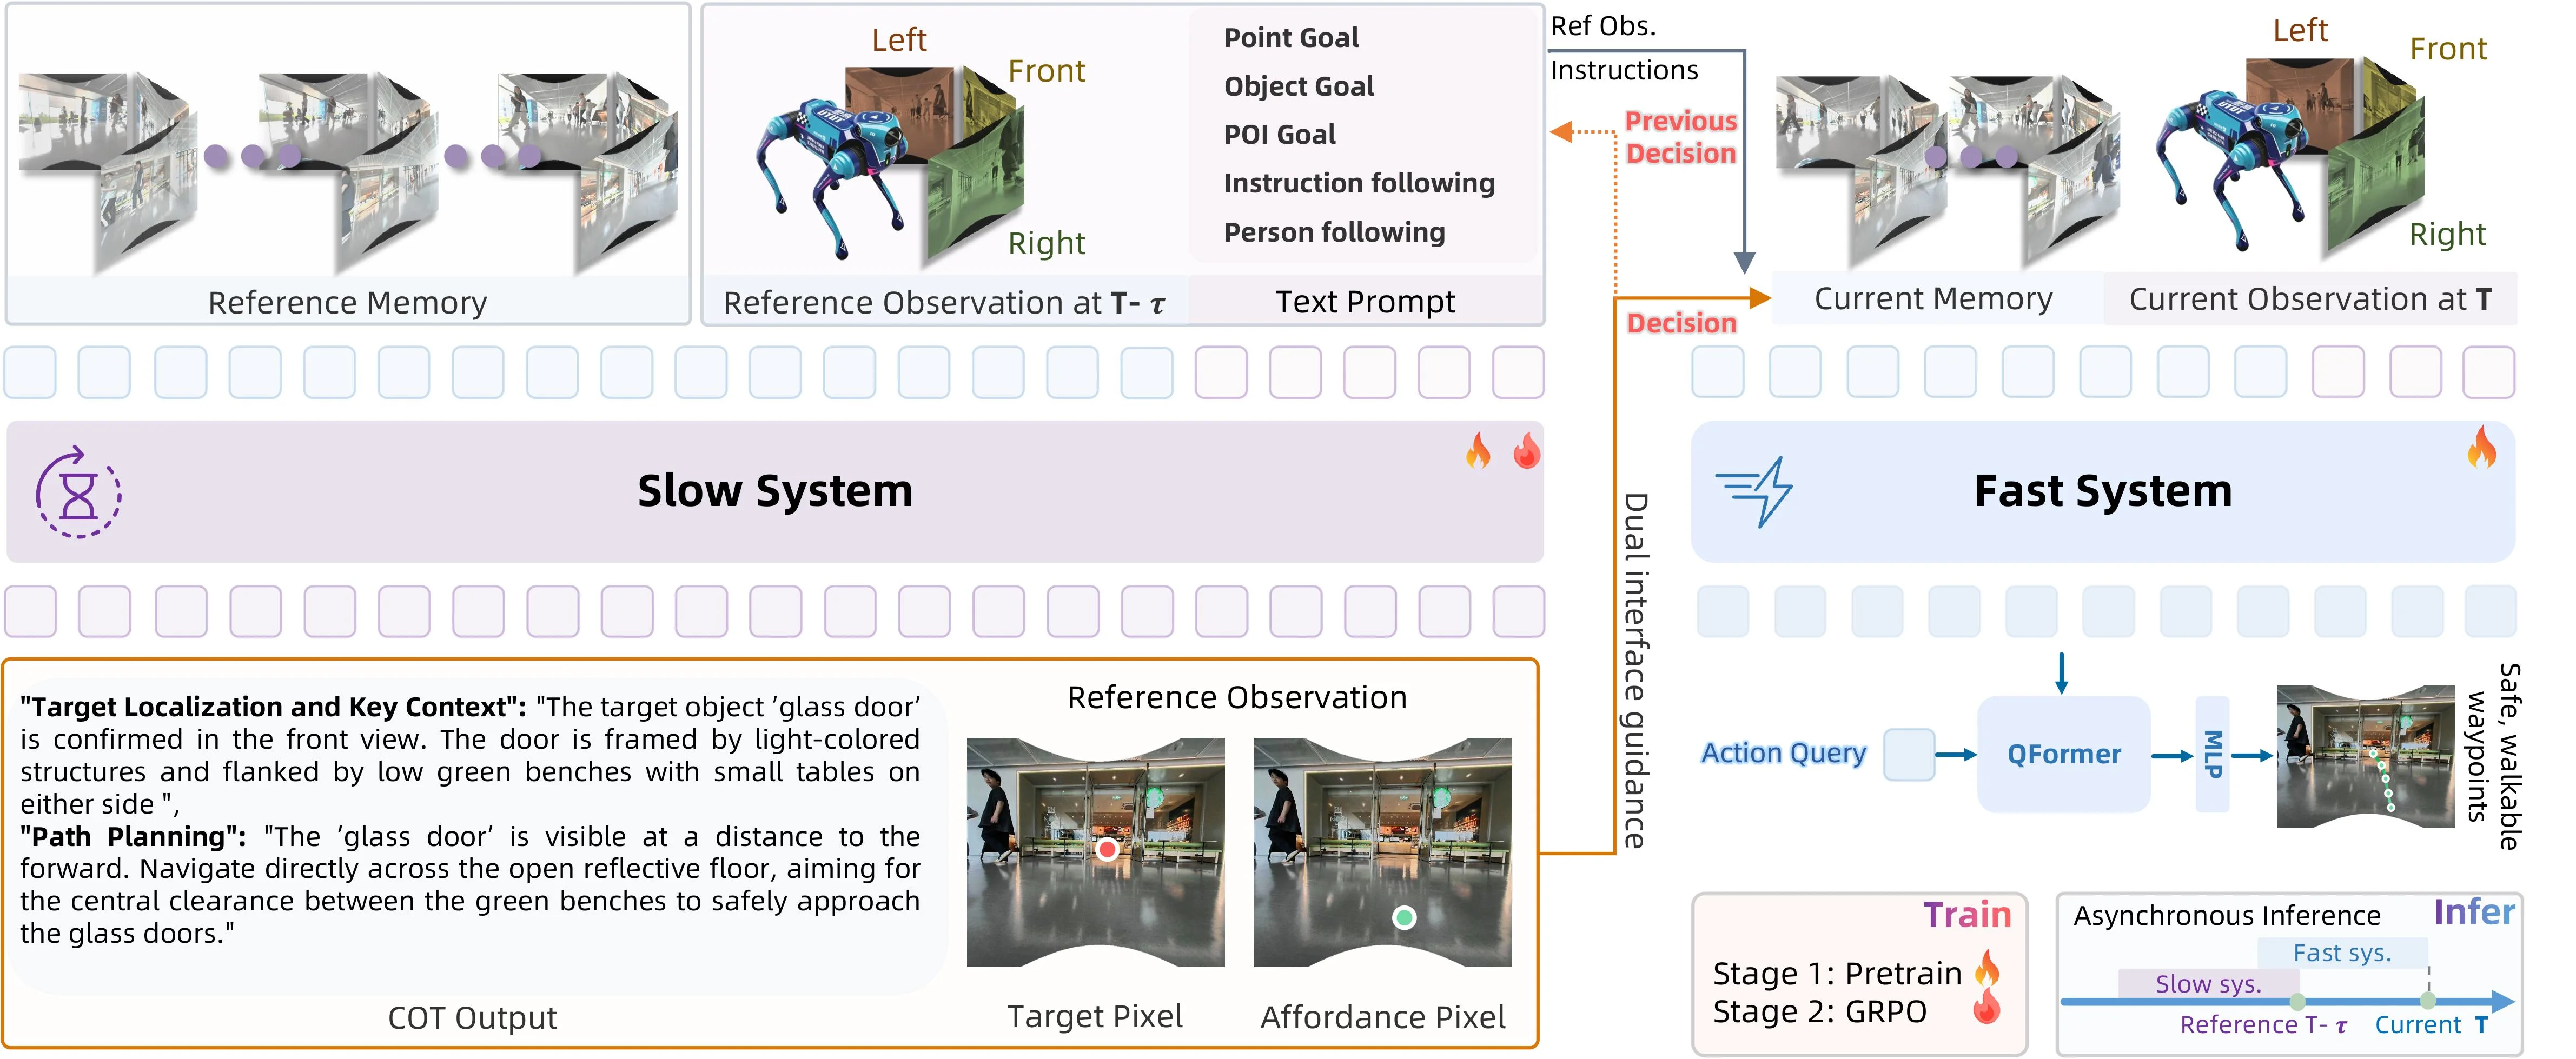
Figure 2 : The Slow-Fast Dual-System Architecture of ABot-N1. Navigation is decoupled into asynchronous cognition and high-frequency control. Slow System (left): A vision-language reasoner processes historical frames and task prompts at low frequency, producing explicit CoT reasoning and visual anchors (Target Pixel and Affordance Pixel). Dual Vision-Language Interface (middle): The language and visual outputs form a unified bridge between the two systems. Fast System (right): A lightweight-VLM-based action expert integrates the dual guidance with real-time observations; a learnable action query attends to the output hidden states via a QFormer module, and an MLP decodes the queries to predict continuous waypoints. The system is trained with pretraining and GRPO, enabling complex reasoning without blocking the reactive control loop.

This diagram illustrates the slow-fast dual-system architecture of ABot-N1, designed for visual-language navigation tasks. We can break down its components, information flow, and operational principles as follows:

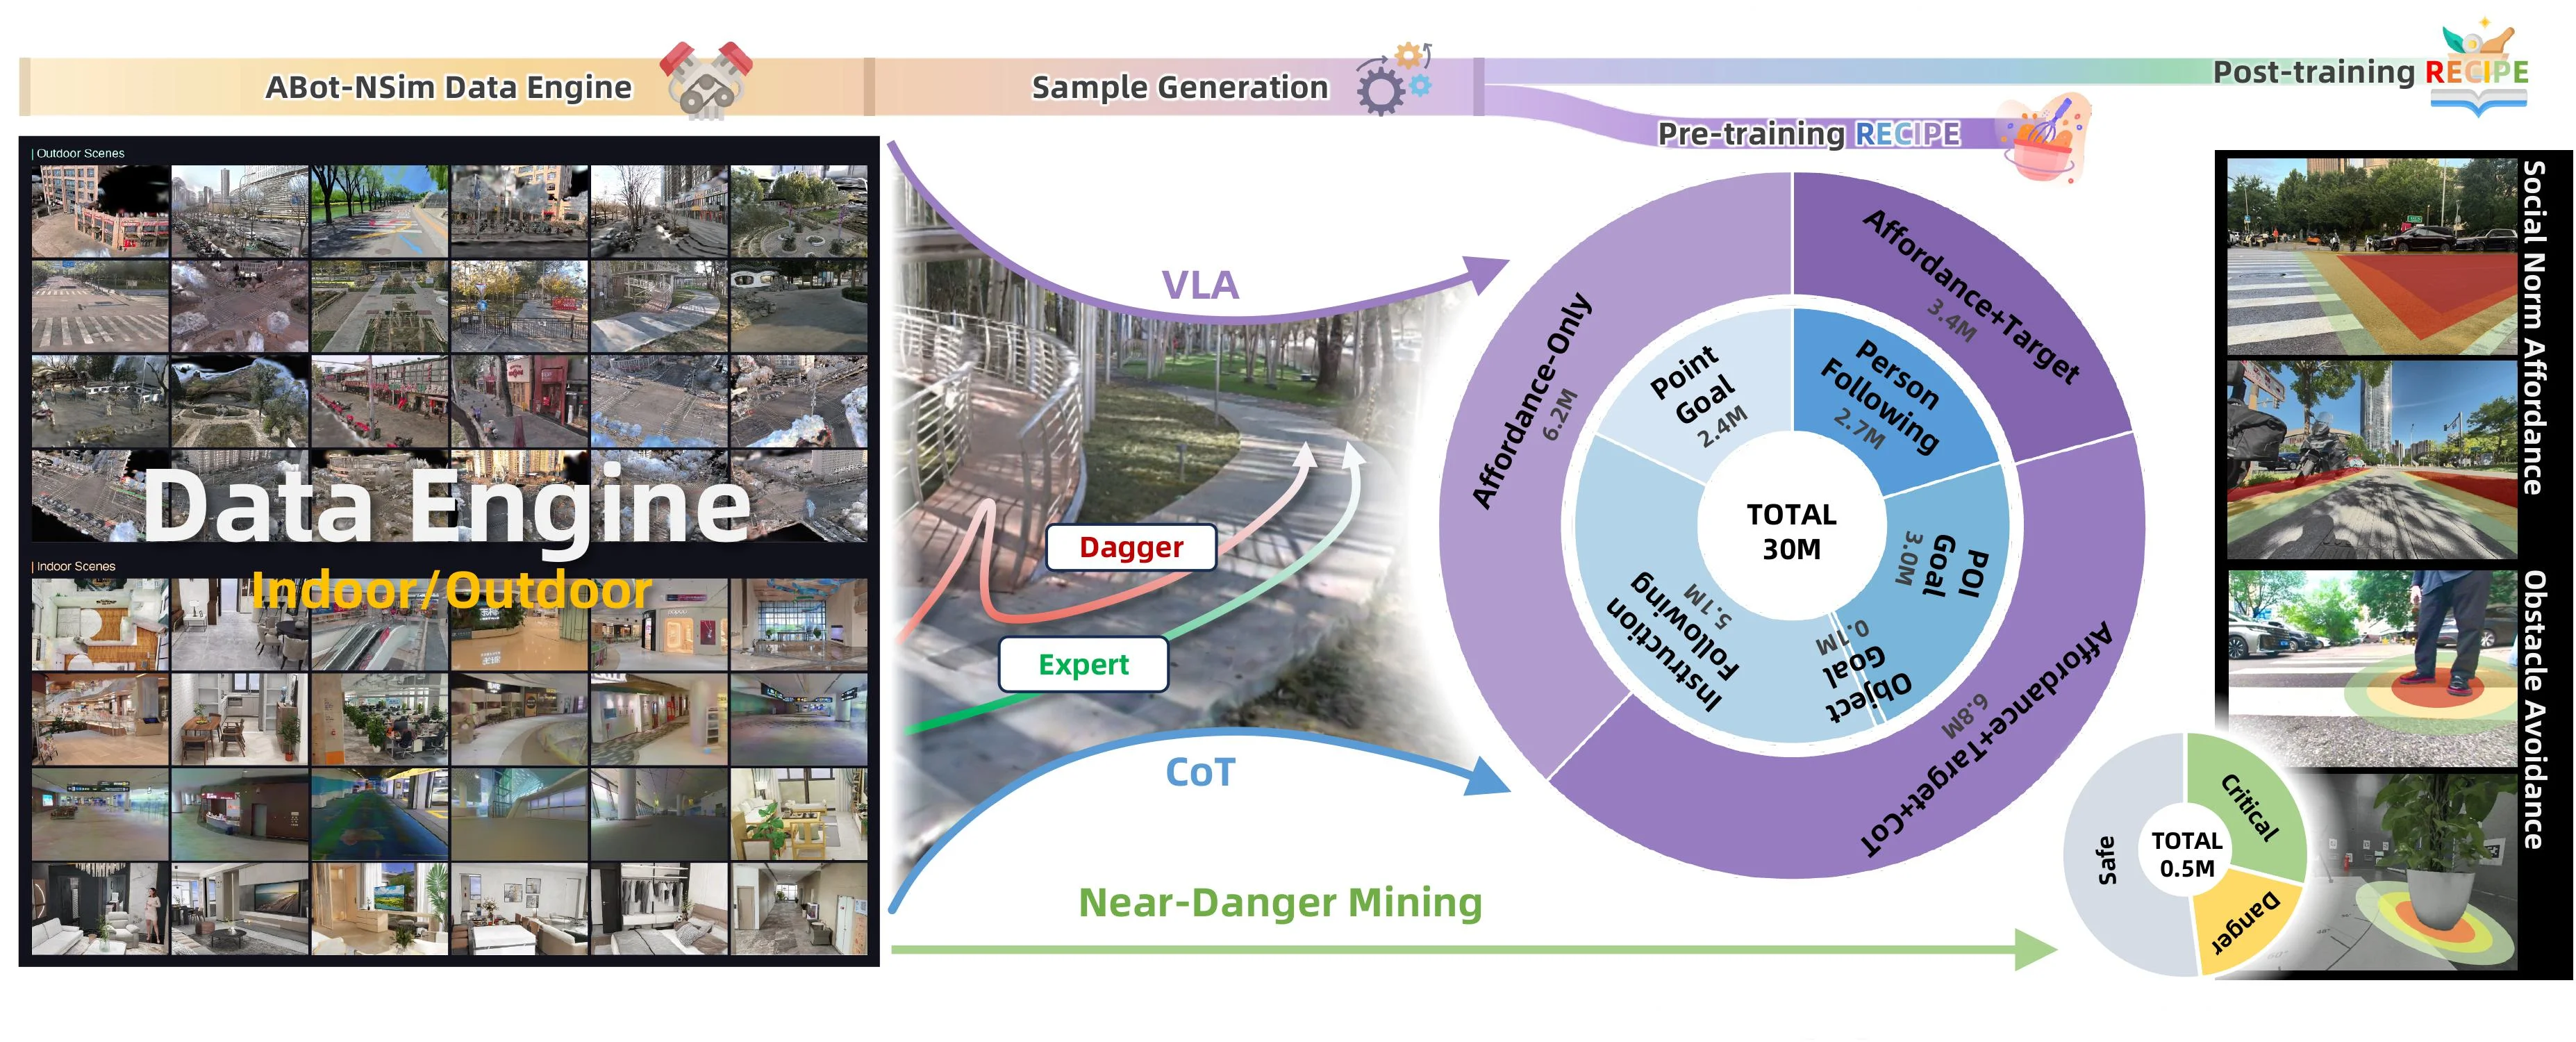
Figure 3 : Data Pipeline and Composition. The data engine (left) provides diverse indoor and outdoor simulation scenes; trajectory generation (middle) produces expert and Dagger rollouts; the resulting samples (right) span both stages—the five pre-training navigation tasks broken down by slow-system (high-level) and fast-system (low-level) counts, together with the post-training composition stratified into Safe, Critical, Danger, and discarded data.

This figure illustrates the data pipeline and composition of the ABot - N1 method. We can understand each part by following the data flow from left to right:

First, look at the "ABot - NSim Data Engine" section on the far left. This data engine is responsible for providing diverse indoor and outdoor simulation scenes. From the figure, we can see that the upper part is "Outdoor Scenes", showing images of various outdoor environments such as streets and parks; the lower part is "Indoor Scenes", presenting images of indoor environments such as shopping malls and rooms, and it is labeled "Indoor/Outdoor", indicating that the data engine generates simulation scenes covering different indoor and outdoor environments, providing a basic data source for subsequent trajectory generation.

Next is the "Sample Generation" (sample generation) part in the middle. There are two main trajectory generation methods here: a red arrow process labeled "Dagger" and a green arrow process labeled "Expert", as well as related processes of "VLA" (possibly a module related to vision - language - action), "CoT" (Chain - of - Thought, thinking chain) and "Near - Danger Mining" (near - danger mining). Specifically, "Dagger" and "Expert" should be two ways to generate expert trajectories and trajectories similar to expert behaviors (Dagger is usually an iterative method in imitation learning, and here it may be used to generate trajectories close to expert behaviors). "VLA" and "CoT" may be related to the slow system (high - level cognition) and the fast system (low - level control) respectively, and "Near - Danger Mining" is to mine near - danger scene data from these trajectories for subsequent processing. The data flow direction is from the scene input of the data engine, through these trajectory generation methods, to generate samples for training.

Then look at the circular chart in the middle - right, which is the "Pre - training RECIPE" (pre - training recipe) part, showing the five navigation tasks in pre - training and their corresponding sample quantities of the slow system (high - level) and the fast system (low - level). The total number of samples is 30M (30 million). The specific tasks and quantities are as follows: - "Affordance - Only" (only affordance): 6.2M; - "Point Goal" (point goal): 2.4M; - "Instruction Following" (instruction following): 5.7M; - "Object Goal" (object goal): 0.1M; - "POI Goal" (point of interest goal): 3.0M; - "Person Following" (person following): 2.7M; - "Affordance + Target" (affordance + target): 3.4M; - "Affordance + Target + CoT" (affordance + target + chain - of - thought): 6.8M. These tasks are divided into the slow system (high - level, such as tasks that require explicit chain - of - thought reasoning) and the fast system (low - level, such as tasks that directly generate actions according to pixel goals). Through different task types and quantities, the composition of the data in the pre - training stage is shown, and these data come from the trajectories in the middle sample generation part.

Then look at the "Post - training RECIPE" (post - training recipe) part on the far right. This is a classification of data security, with a total of 0.5M (500,000) data, divided into "Safe" (safe), "Critical" (critical), "Danger" (danger) and "discarded data" (discarded data). However, the figure mainly shows the proportions of "Safe", "Critical" and "Danger", among which "Safe" is the gray part, "Critical" is the green part, and "Danger" is the yellow part. This part is to classify the data after training, possibly according to the safety of the scene, for further analysis or optimization of the model.

From the overall logic of data flow, first, the data engine generates indoor and outdoor simulation scene data, then generates training samples through the sample generation part (including expert trajectories, Dagger trajectories, etc., combined with visual - language reasoning (CoT) and near - danger mining), then uses these samples for five pre - training navigation tasks (distinguishing between the explicit reasoning tasks of the slow system and the action generation tasks of the fast system), and finally classifies the data after training (according to security). The whole process shows the complete data pipeline from data generation, sample generation, pre - training to post - training, explaining how the ABot - N1 method uses diverse scene data, generates training samples through different trajectory generation methods and task types, and then classifies the data after training to achieve the complete process from data to model training to post - processing, so as to solve the problems of coordinate drift, poor handling of long - tail semantics and lack of interpretability in current visual language navigation methods, and achieve more robust, generalizable and interpretable navigation by decoupling cognition (slow system) and control (fast system).

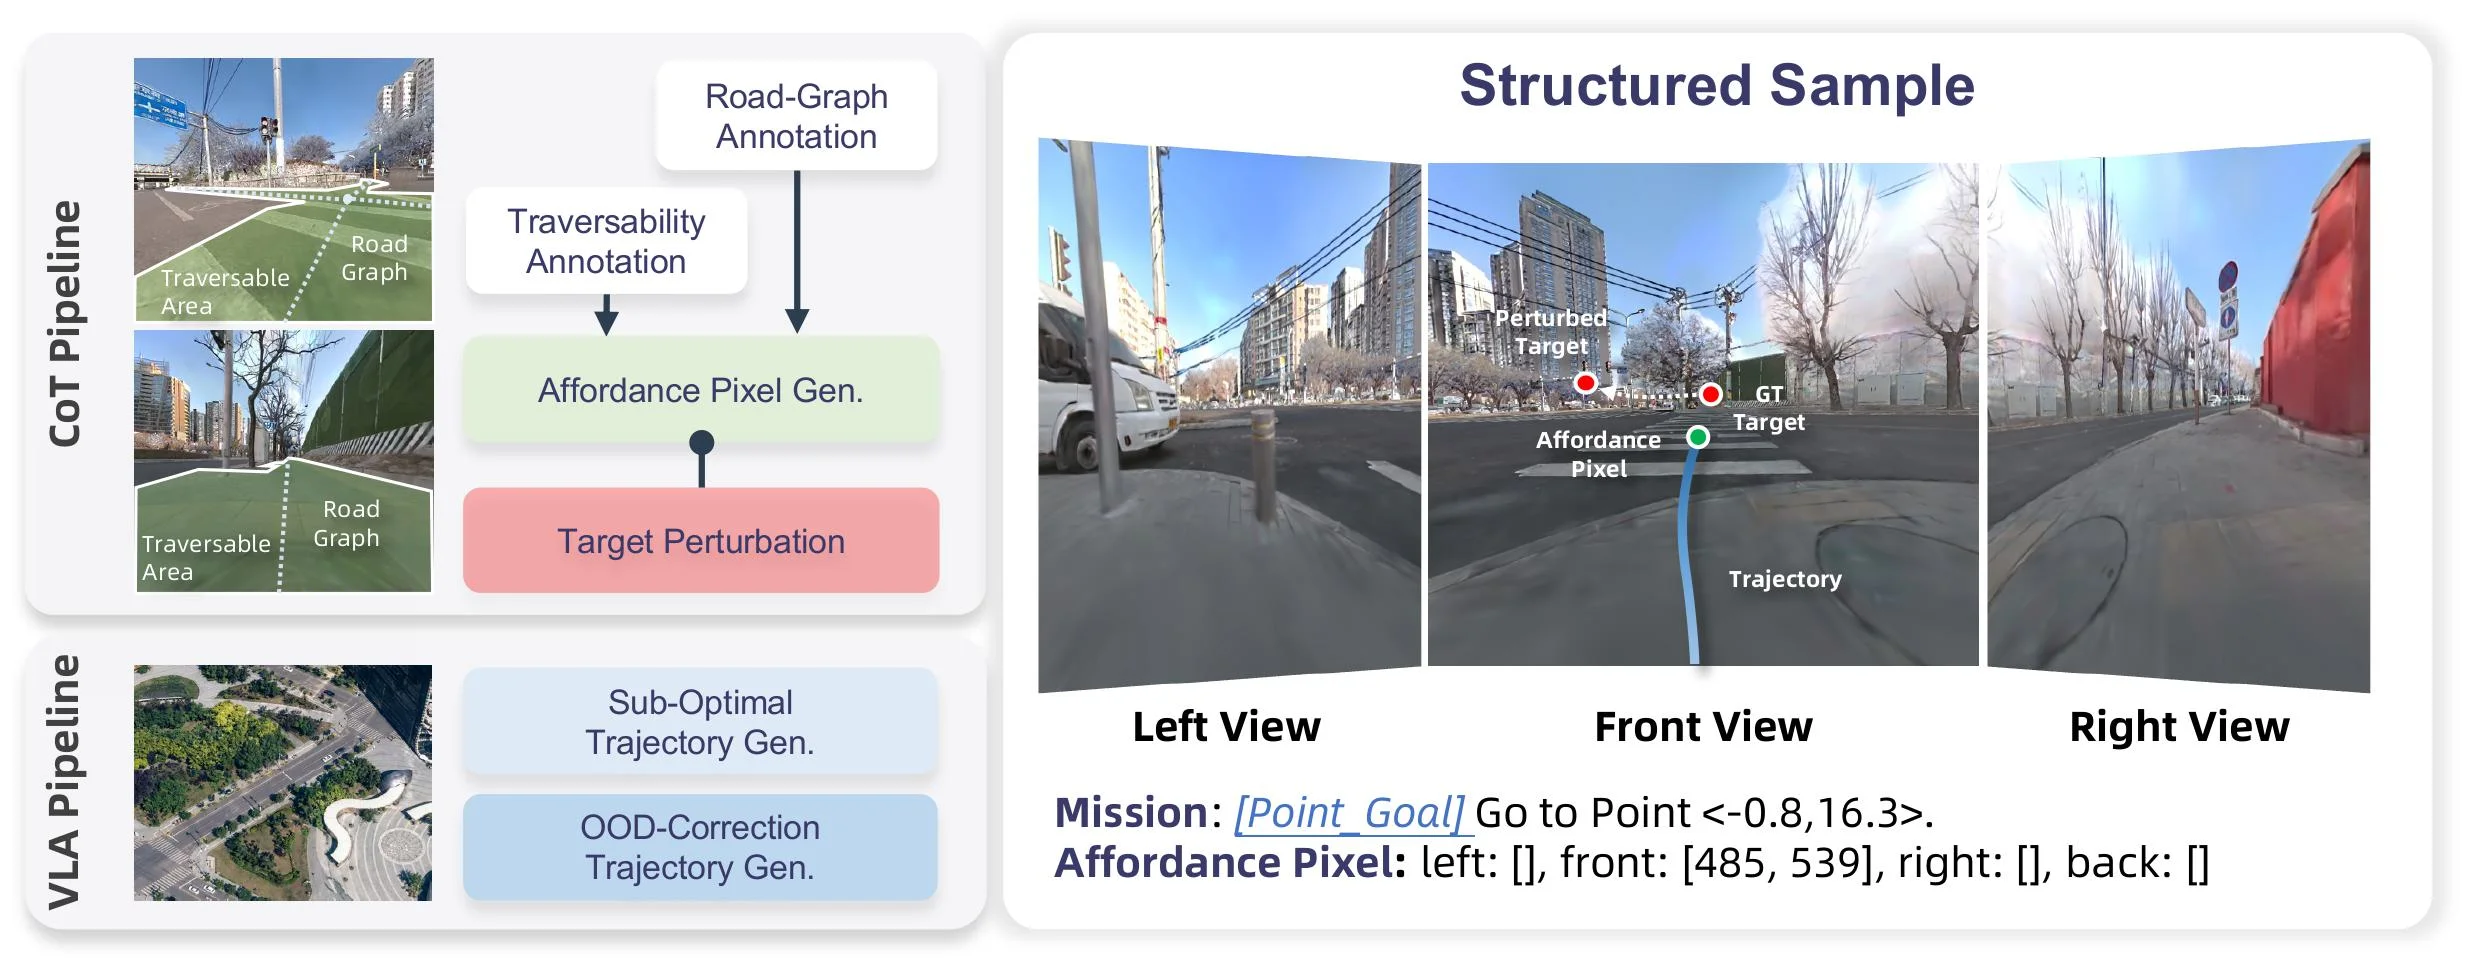
Figure 4 : Data Construction Pipeline for the Point-Goal Corpus. Left: the data construction pipeline in two parts. The top half is the CoT data construction, which generates affordance pixels from the traversability and road-graph annotations and perturbs the target coordinate; the bottom half is the VLN data construction, comprising sub-optimal trajectory and OOD-correction trajectory synthesis. Right: an example structured sample with tri-view observations and affordance pixel annotation.

This diagram (Figure 4) illustrates the data construction process used in the paper for the Point-Goal Corpus, and explains the organization of the data through a structured sample example.

Let's break down the left part of the diagram, which is the data construction pipeline:

  1. Upper Left Part: CoT Data Construction Pipeline (CoT Pipeline)

    • Input Image and Annotations: The far left shows two images with annotations. These images have "Traversable Area" marked with green regions and "Road Graph Area" outlined with dashed boxes. This represents semantic segmentation or structured information of the environment.
    • Road-Graph Annotation: This is a processing step that extracts or utilizes existing road graph information from the input image. A road graph typically includes topological structures of roads, lane lines, etc.
    • Traversability Annotation: This is another processing step that extracts or utilizes existing traversability information from the input image, i.e., which areas the robot can safely walk on.
    • Affordance Pixel Gen. (Affordance Pixel Generation): This module receives information from both "Road-Graph Annotation" and "Traversability Annotation." Its function is to generate "affordance pixels." In the example on the right side of the diagram, "Affordance Pixel" is annotated as "front: [485, 539]," which means that in the front view, the pixel at coordinates (485, 539) is marked as a location with a specific affordance (e.g., a reachable target point or its vicinity). This process converts high-level road and traversability information into concrete anchors in image space.
    • Target Perturbation: This module receives the output from "Affordance Pixel Gen." and perturbs the target coordinates. In the example on the right side of the diagram, you can see a "Target" (green dot) and a "Perturbed Target" (red dot). This perturbation is likely to increase the diversity of training data, making the model more adaptable to small changes in target positions.
    • Data Flow: Image -> Road-Graph Annotation -> Traversability Annotation -> Affordance Pixel Gen. -> Target Perturbation. This pipeline generates image data with affordance pixel annotations for targets that have been perturbed.
  2. Lower Left Part: VLN Data Construction Pipeline (VLA Pipeline): Here, "VLA" might stand for "Visual Language Action" or a similar concept, related to the construction of the point-goal corpus.

    • Sub-Optimal Trajectory Gen. (Sub-Optimal Trajectory Generation): This module is responsible for generating sub-optimal navigation trajectories. Sub-optimal trajectories can be used to train the model to avoid bad paths or learn recovery strategies.
    • OOD-Correction Trajectory Gen. (Out-of-Distribution Correction Trajectory Generation): This module is responsible for generating trajectories for out-of-distribution (OOD) correction. OOD refers to situations the model might encounter that are unseen or outside its training distribution; correction trajectories help the model recover or adjust its behavior in such cases.
    • Data Flow: This part of the pipeline is relatively independent and is likely used to generate different types of training trajectory data to enhance the model's robustness and generalization能力.

Next, we look at the right part of the diagram, which is the Structured Sample Example:

  1. Tri-view Observations (Three-View Observations):

    • Left View: Displays the visual observation from the robot's left side.
    • Front View: Displays the visual observation from the robot's front. In this view, there is a blue trajectory line, a green "Target" point, a red "Perturbed Target" point, and a green "Affordance Pixel" point. The trajectory line points from the robot's current position (implicitly at the bottom-left of the view) to the target.
    • Right View: Displays the visual observation from the robot's right side.
    • These multi-view images simulate the actual visual input of the robot.
  2. Mission and Annotation:

    • Mission: [Point_Goal] Go to Point <-0.8, 16.3>. This indicates that the task is a point-goal navigation task, with the goal being to reach the point (-0.8, 16.3) in the world coordinate system.
    • Affordance Pixel: left: [], front: [485, 539], right: [], back: [] This indicates that there are no affordance pixels in the left view, one affordance pixel at coordinates (485, 539) in the front view, and none in the right or back views. This affordance pixel is generated from the CoT data construction process on the left and serves as an anchor in image space, associated with the high-level task goal (world coordinates).

How the Method Shown in the Diagram Works:

This method (part of ABot-N1) operates as follows:

  • Data Preparation Phase:
    • First, a point-goal navigation corpus is constructed. The construction of this corpus is divided into two main parts:
      1. CoT Data Construction: Utilizes road graph and traversability annotations to generate "affordance pixels" in image space. These pixels act as concrete target points or key anchors. Perturbing the target coordinates increases the diversity of training data. This process combines visual language reasoning (Chain-of-Thought) to explicitly generate these anchors.
      2. VLN Data Construction: Generates sub-optimal trajectories and out-of-distribution (OOD) correction trajectories to train the model's robustness and recovery capabilities.
  • Model Operation Phase (although the model itself is not directly shown in the diagram, it can be inferred from the data construction):
    • The model (e.g., ABot-N1) receives current multi-view image observations.
    • The model uses knowledge learned from the CoT data to identify "affordance pixels" in the images, which represent reachable targets or key locations.
    • The model associates these image-space anchors with high-level task instructions (e.g., "Go to Point ").
    • Then, a "fast action expert" module uses these image-space anchors and textual cues to generate continuous waypoints to control the robot's movement.

Summary:

This diagram details the process of building a dataset for point-goal navigation tasks. It emphasizes the importance of converting high-level task goals (e.g., points in a world coordinate system) into low-level image-space anchors (affordance pixels). In this way, the model can better understand spatial relationships and navigate in different views and environments. The structured sample example in the diagram clearly shows the correspondence between multi-view observations, task descriptions, and image-space anchors (affordance pixels). This method aims to improve the generalization, robustness, and interpretability of visual language navigation models.

The example on the right side of the diagram specifically illustrates: * The task is to go to the world coordinate <-0.8, 16.3>. * In the front view, the pixel at coordinates [485, 539] is marked as "Affordance Pixel," representing a key point or the target itself on the path to the goal. * The image also shows the actual "Target" (green dot) and the perturbed "Perturbed Target" (red dot), as well as the "Trajectory" (blue line) from the current position to the target.

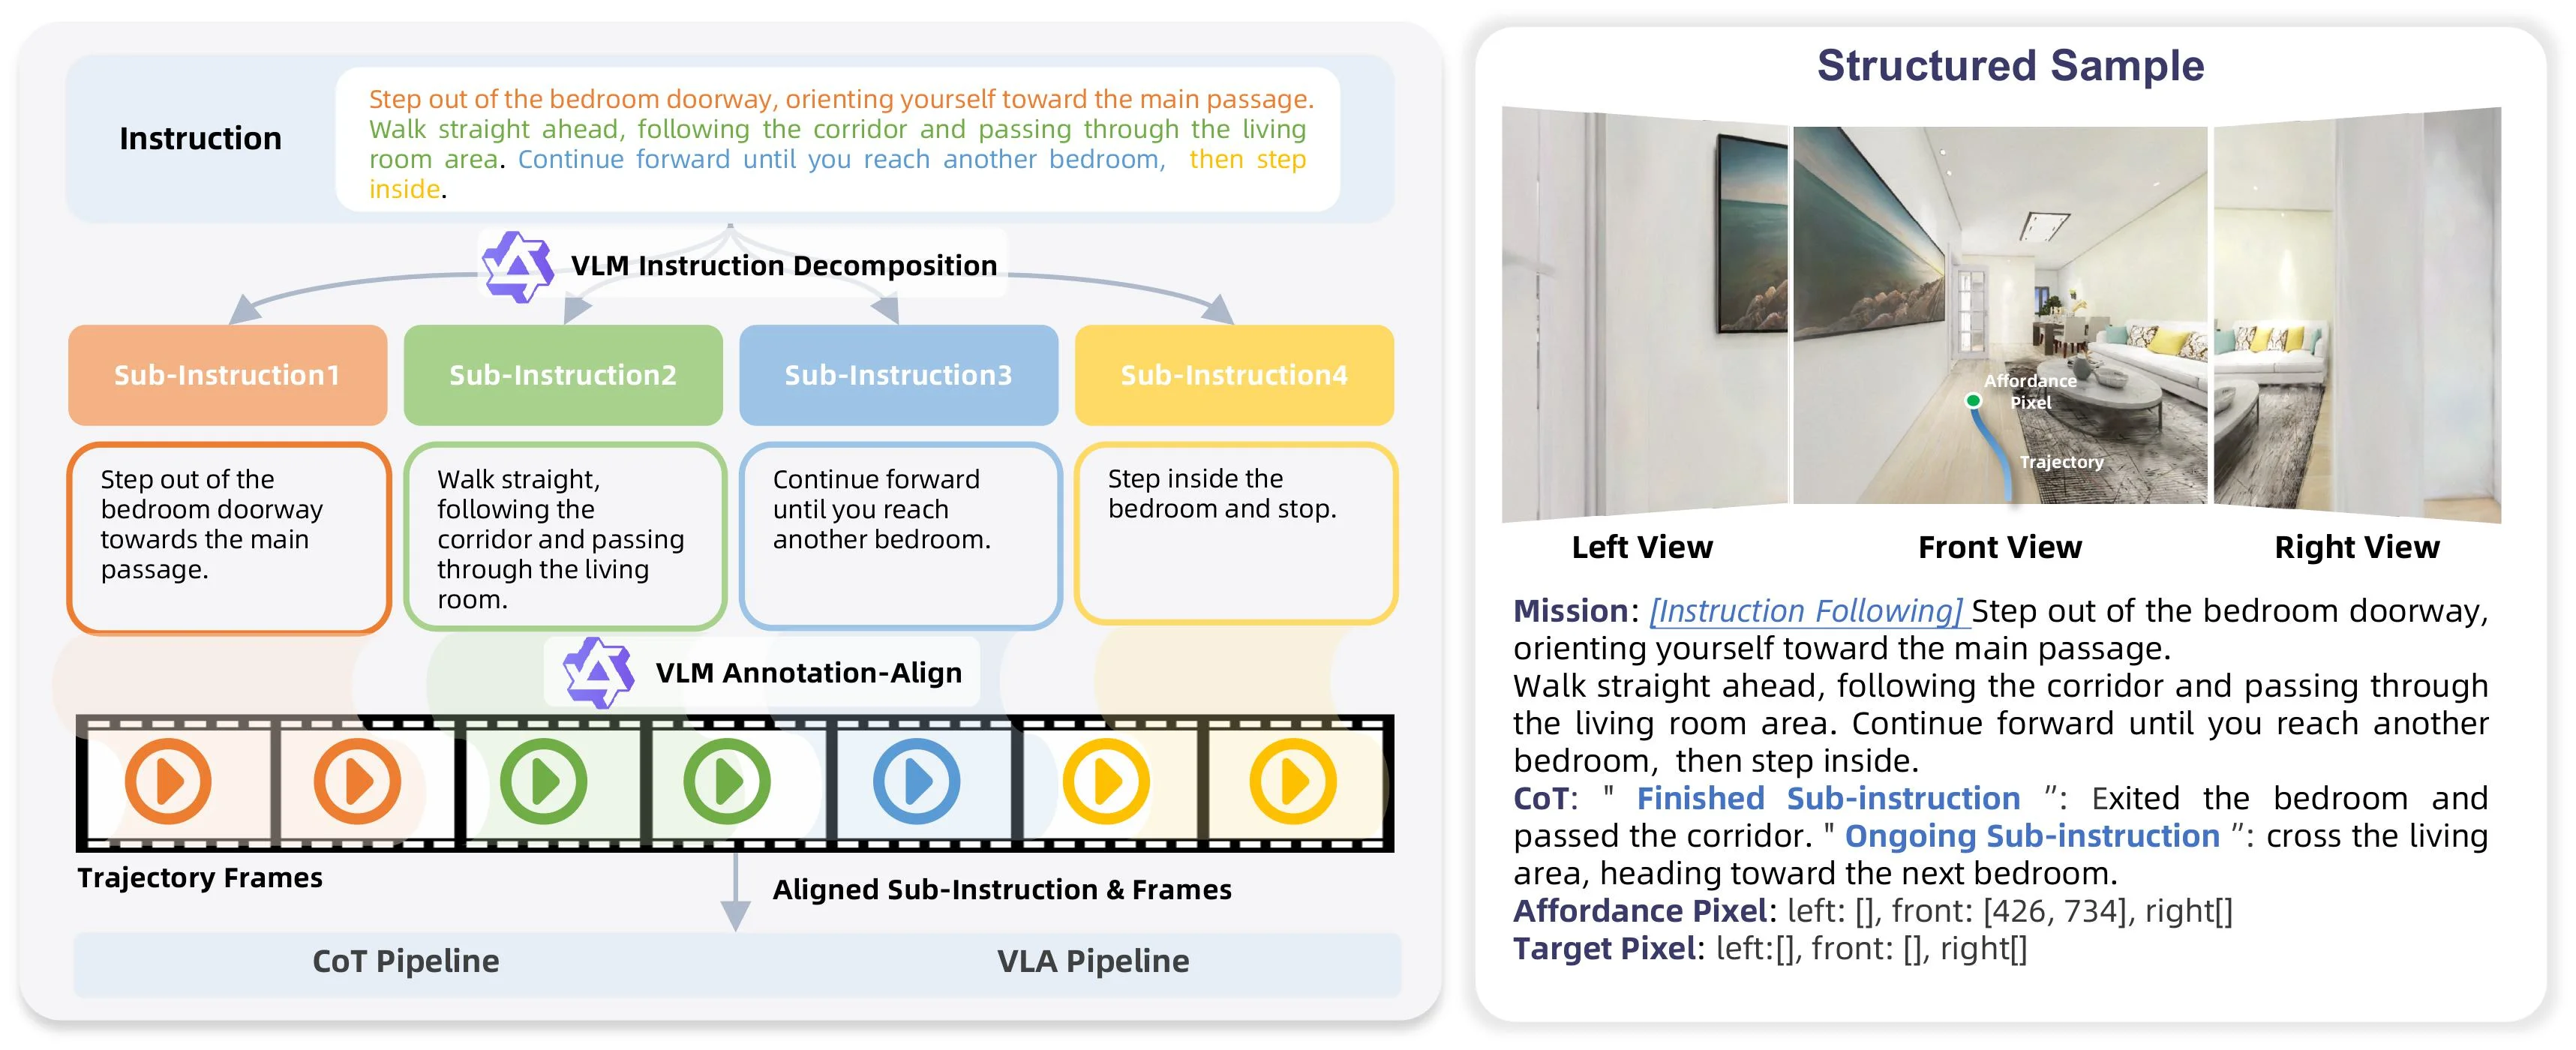
Figure 5 : Data Construction Pipeline for the Instruction-Following Corpus. Left: a three-stage pipeline that decomposes long natural-language instructions into short sub-instructions, aligns each sub-instruction to its corresponding frame range along the milestone path, and generates and verifies affordance and target pixels for CoT and VLN data. Right: an example structured sample showing tri-view observations with the language instruction and pixel-level annotations for affordance and target.

This diagram (Figure 5) illustrates the data construction pipeline for an instruction-following corpus, divided into two main sections—left and right—that clearly explain the conversion process from natural language instructions to structured data samples.

Left Section: Three-Stage Data Processing Pipeline
The left side outlines a three-stage pipeline that breaks down long natural language instructions into shorter sub-instructions, aligns them with corresponding frame ranges in a trajectory path, and generates/validates affordance pixels and target pixels for Chain-of-Thought (CoT) and Visual Language Navigation (VLN) data.

  1. Instruction Decomposition
  2. The top "Instruction" box contains a full natural language navigation command (e.g., "Step out of the bedroom doorway... continue forward until you reach another bedroom, then step inside.").
  3. This long instruction is processed by the "VLM Instruction Decomposition" module, which splits it into shorter "Sub-Instructions," shown in four colored boxes:
    • Sub-Instruction 1 (Orange): "Step out of the bedroom doorway towards the main passage."
    • Sub-Instruction 2 (Green): "Walk straight, following the corridor and passing through the living room."
    • Sub-Instruction 3 (Blue): "Continue forward until you reach another bedroom."
    • Sub-Instruction 4 (Yellow): "Step inside the bedroom and stop."
  4. This step simplifies a complex navigation task into smaller, manageable steps.

  5. Sub-Instruction & Frame Alignment

  6. The decomposed sub-instructions are aligned with "Trajectory Frames" via the "VLM Annotation-Align" module.
  7. The "Trajectory Frames" section displays a sequence of video frames, each marked with a play button and color-coded (orange, green, blue, yellow) to match their corresponding sub-instructions.
  8. The result is "Aligned Sub-Instruction & Frames," where each sub-instruction is mapped to its specific visual segment in the trajectory.

  9. Pixel Annotation Generation & Verification

  10. Aligned data is used to generate and validate "Affordance Pixels" (actionable locations) and "Target Pixels" (destinations) as anchor points in image space.
  11. The aligned data flows into the "CoT Pipeline" and "VLA Pipeline," indicating its use in subsequent reasoning and control stages.

Right Section: Structured Sample Example
The right side shows a structured sample with tri-view observations, language instructions, and pixel-level annotations.

  1. Tri-View Observations
  2. Displays "Left View," "Front View," and "Right View"—environment images from an agent’s (e.g., robot’s) perspective, simulating visual input during navigation.
  3. The "Front View" includes a blue "Trajectory" line and a green "Affordance Pixel," marking key positions or goals.

  4. Language Instruction

  5. The "Mission" section repeats the full natural language instruction from the left, clarifying the task goal.

  6. Pixel-Level Annotations

  7. Affordance Pixel: Specifies coordinates in left/front/right views (e.g., [426, 734] in Front View).
  8. Target Pixel: Coordinates for the destination (all empty [] in this example, possibly indicating the target is unmarked or pending).

  9. Chain-of-Thought (CoT)

  10. The CoT section details the agent’s decision-making process, distinguishing between:
    • "Finished Sub-instruction" (e.g., "Exited the bedroom and passed the corridor.")
    • "Ongoing Sub-instruction" (e.g., "cross the living area, heading toward the next bedroom.")

Summary of the Data Construction Process
The method follows four key steps:
1. Decompose long navigation instructions into short sub-instructions.
2. Align sub-instructions with corresponding trajectory frames.
3. Generate/validate pixel-level annotations (affordance/target pixels) for precise navigation goals.
4. Combine aligned sub-instructions, frames, and annotations into a structured sample, including the full task instruction and CoT.

This pipeline embodies a core idea of ABot-N1: transforming high-level natural language into low-level, pixel-specific navigation targets. By breaking tasks into interpretable, verifiable steps with clear visual-language mappings, it enables robust and generalizable visual language navigation.

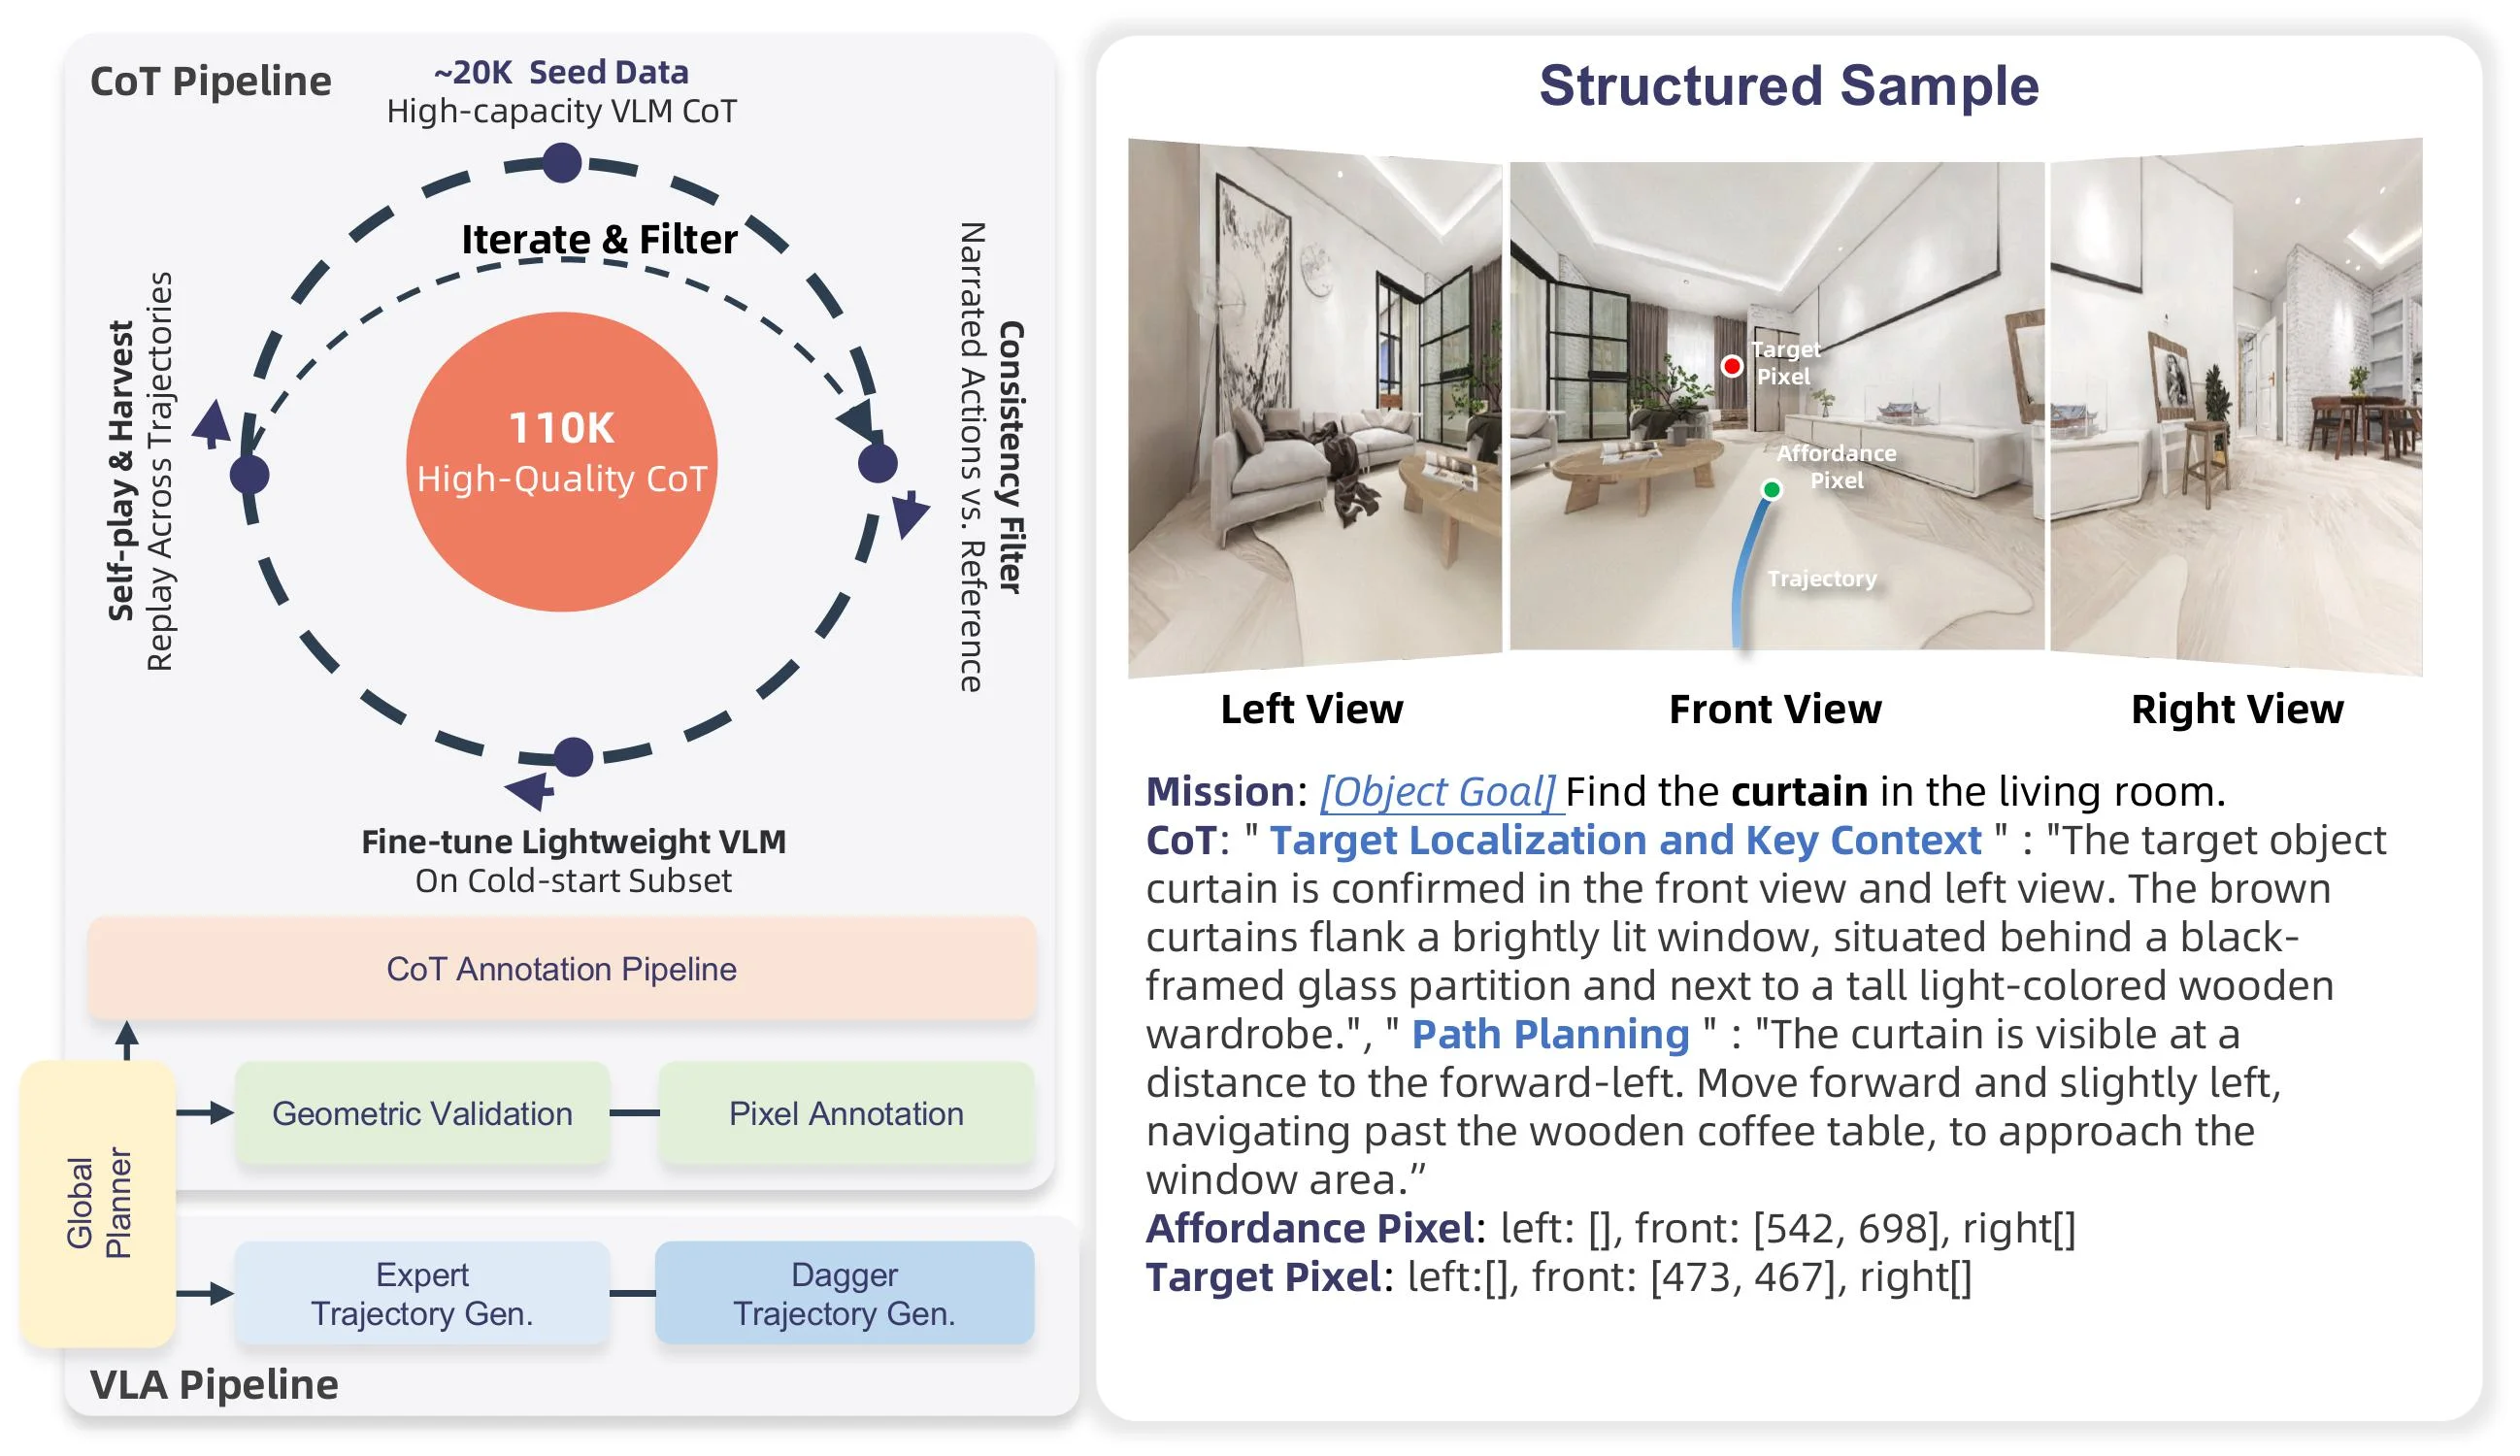
Figure 6 : Data Construction Pipeline for the Object-Goal Corpus. The left panel comprises two parts: the top half illustrates the iterative data flywheel that constructs the CoT rationales, scaling high-capacity VLM data seeds to 110 K high-quality structured samples through A ∗ {}^{\!*} consistency filtering and self-play harvesting; the bottom half depicts the VLN pipeline that produces the low-level supervision, including pixel annotation and OOD-correction trajectory generation. The right panel demonstrates the resulting structured tuple, featuring tri-view observations, explicit object and affordance pixel grounding, and detailed two-block CoT rationales.

This diagram (Figure 6) illustrates the data construction pipeline of the Object-Goal Corpus, divided into two panels (left and right) that clearly explain the entire process from raw data to high-quality structured samples, as well as the composition of the final structured tuples.

Left Panel: Two Sub-Sections

  1. Top Half: CoT Reasoning Iterative Data Flywheel
  2. Describes how "Chain-of-Thought (CoT)" explanations are built.
  3. Starts with "~20K Seed Data" generated by a "High-capacity VLM CoT" (Visual-Language Model Chain-of-Thought).
  4. These seeds enter an iterative filtering process ("Iterate & Filter"), optimized via "A* consistency filtering" and "self-play harvesting" to expand data quality/quantity.
  5. Arrows show cyclic data flow, ultimately producing "110K High-Quality CoT" through repeated refinement.
  6. Additional input: "Consistency Filter Narrated Actions vs. Reference" (ensures alignment between generated and reference actions during filtering).
  7. Labeled as the "CoT Annotation Pipeline."

  8. Bottom Half: VLN Pipeline (Visual-Language Navigation Pipeline)

  9. Generates low-level supervision signals for navigation behavior.
  10. Starts with a "Global Planner," whose output splits into two paths:
    • Path 1: "Geometric Validation" → "Pixel Annotation" (verifies planned paths and labels pixel coordinates for objects like targets or interactable items).
    • Path 2: "Expert Trajectory Gen." → "Dagger Trajectory Gen." (uses imitation learning to refine/explore diverse trajectories).
  11. Labeled as the "VLA Pipeline" (likely short for "Low-Level Action Pipeline").

Right Panel: Final Structured Sample

  • Header: "Structured Sample"
  • Image Section: Three viewpoint observations—"Left View," "Front View," "Right View"—simulating an agent’s visual input.
  • Mission: "[Object Goal] Find the curtain in the living room." (defines the task).
  • CoT (Chain-of-Thought):
  • "Target Localization and Key Context": Describes the target’s location (e.g., "The curtain is confirmed in front/left views, flanking a bright window near a glass partition and wardrobe.").
  • "Path Planning": Details navigation steps (e.g., "Move forward-left past the coffee table to reach the window area.").
  • Pixel Anchors:
  • "Affordance Pixel": Labels interactable objects (e.g., "[542, 698]" in front view for a coffee table).
  • "Target Pixel": Labels the target (e.g., "[473, 467]" in front view for the curtain).
  • Information Flow: The left panel’s two pipelines (CoT Annotation + VLN) combine to produce the structured sample, integrating high-level reasoning (CoT) and low-level supervision (pixel labels/trajectories) into a tuple with multi-view images, pixel anchors, and detailed CoT justification.

Summary

The diagram outlines ABot-N1’s core data pipeline: iterative CoT generation for high-level intent, combined with VLN-based low-level supervision (pixel labels/trajectories). These are merged into structured samples containing multi-view imagery, pixel anchors for targets/interactable objects, and explainable CoT reasoning—achieving robust, interpretable visual-language navigation by decoupling high-level goals from low-level control.

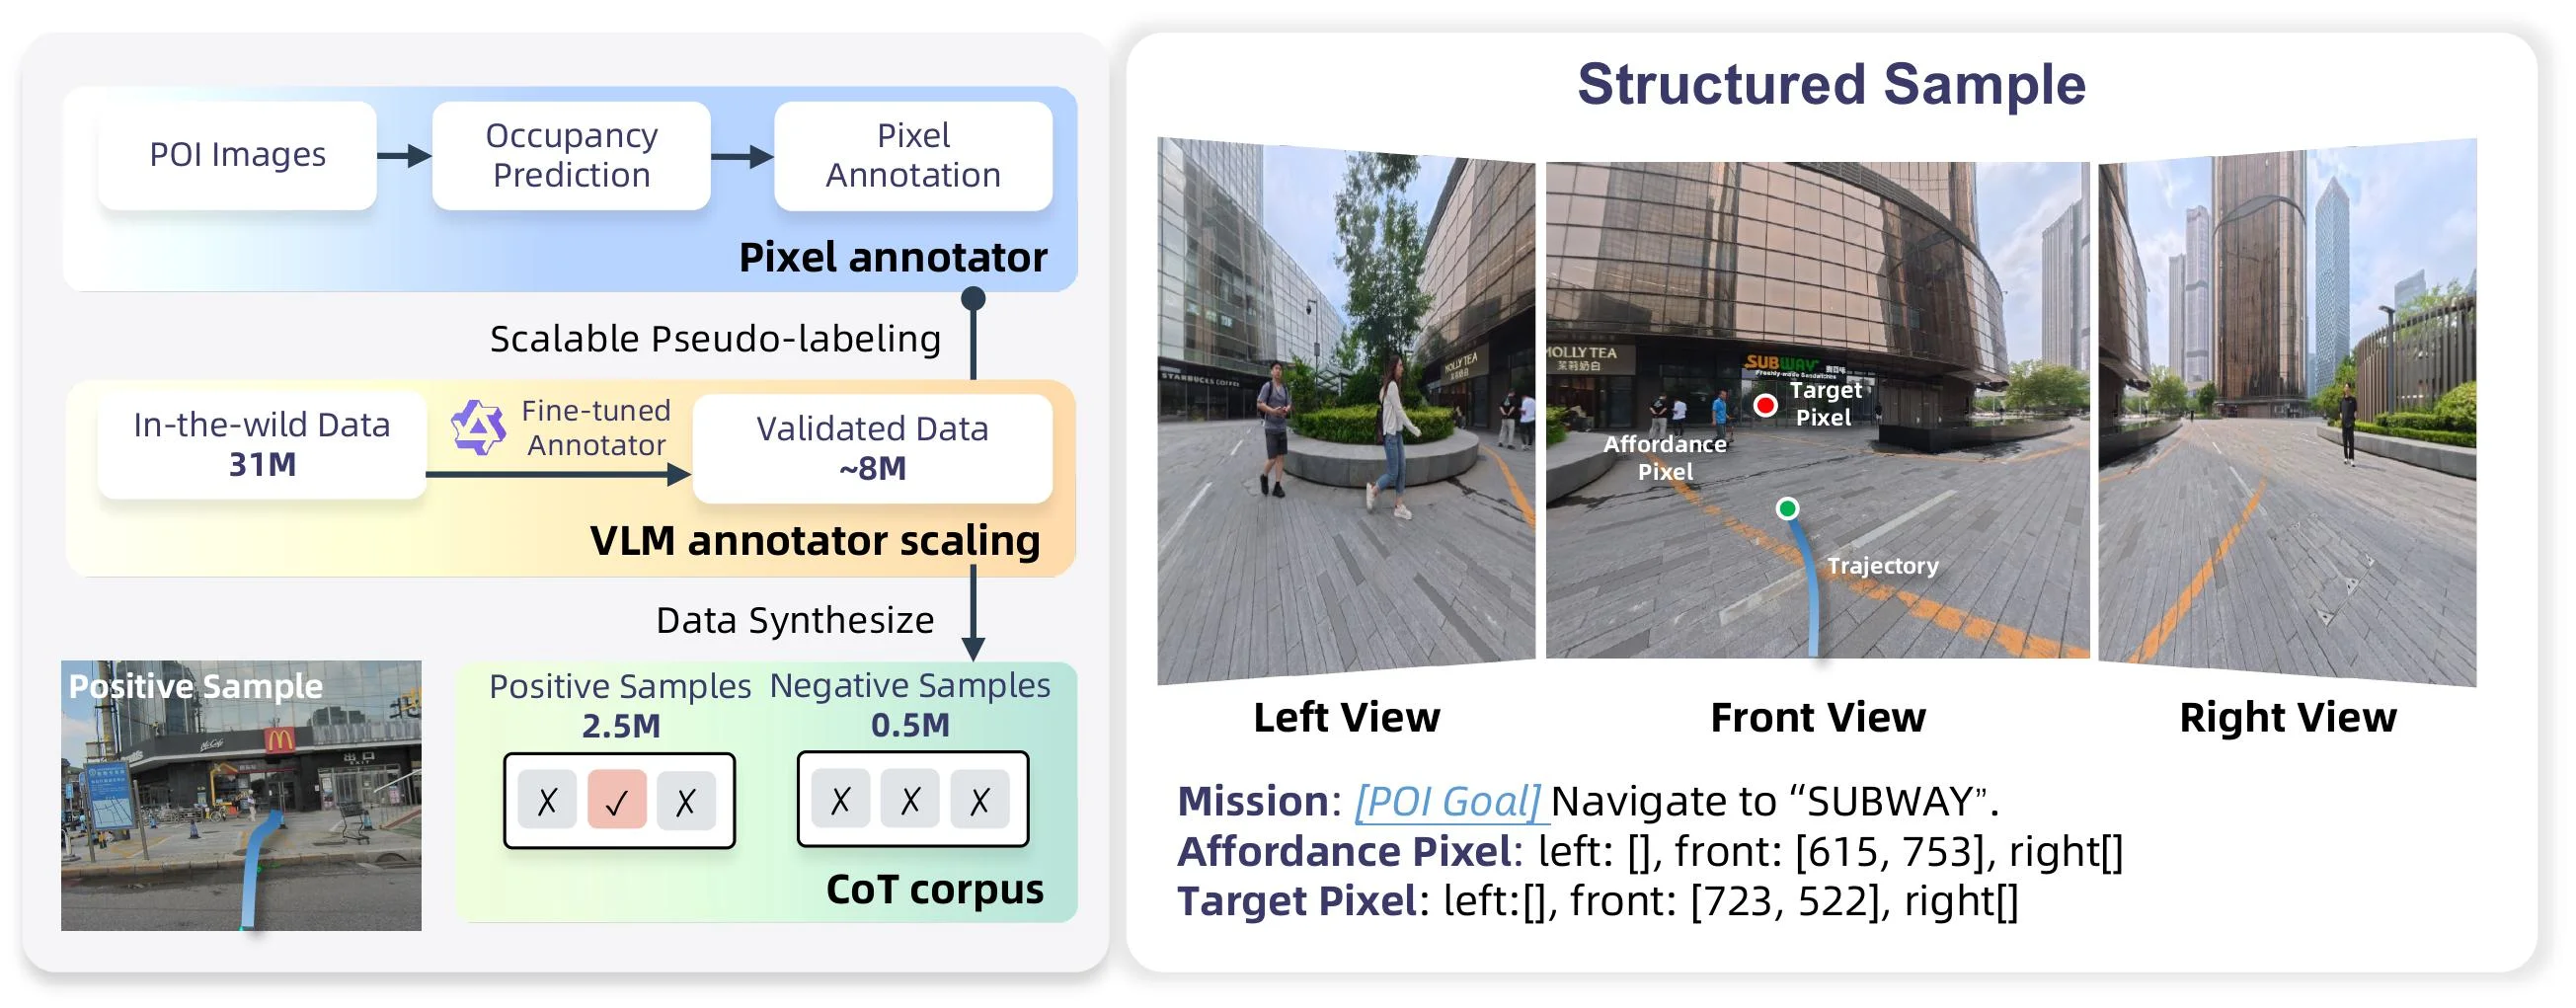
Figure 7 : The Data Construction Pipeline for the POI-Goal Corpus . Left: the three-stage construction flow—generating geometric seed annotations via monocular depth (Stage 1), scaling and filtering 31 M street-view pairs using a distilled VLM (Qwen-3.5-4B) to yield 8 M valid paths (Stage 2), and synthesizing tri-view episodes into positive and negative sample pairs that harden the system’s rejection capability under missing-target conditions (Stage 3). Right: an example structured sample.

This diagram (Figure 7) illustrates the data construction pipeline for the POI target corpus, divided into two main sections (left and right), clearly presenting the complete process from raw data to structured samples.

First, let's examine the left section, which describes the three stages of data construction, with data or information flowing from top to bottom and left to right:

  1. First Stage (Top, Blue Background Box): Generate Geometric Seed Annotations

    • POI Images: The process starts with "Point of Interest Images." These are raw image data containing the target locations.
    • Occupancy Prediction: These POI images first undergo "Occupancy Prediction" processing. This step likely uses techniques like monocular depth estimation to predict the occupancy or spatial location of objects in the image, thereby generating initial geometric annotations.
    • Pixel Annotation: The results of the occupancy prediction are further transformed into "pixel-level annotations." This step assigns specific pixel coordinates to particular targets (e.g., POIs) in the image, forming geometric seed annotations.
    • This stage is labeled "Pixel annotator," responsible for generating initial, precise pixel-level target locations.
  2. Second Stage (Middle, Yellow Background Box): Data Scaling and Filtering

    • In-the-wild Data (31M): Next, the process introduces a large amount of "in-the-wild data," which refers to 31 million pairs of street-view images (or data pairs) collected from the real world.
    • Fine-tuned Annotator & Validated Data (~8M): These large-scale in-the-wild data are processed by a "Fine-tuned Annotator." According to the caption, this annotator is a distilled VLM (Vision-Language Model), such as Qwen-3.5-4B. The role of this annotator is to scale (scale) and filter (filter) the data, ultimately yielding approximately 8 million "Valid Paths" or "Validated Data." This process aims to select high-quality, compliant data from massive raw data.
    • This stage is labeled "VLM annotator scaling," emphasizing the ability to process large-scale data and improve data quality using VLM models.
  3. Third Stage (Bottom, Green Background Box): Synthesize Structured Samples

    • Data Synthesize: The validated effective data is used for "Data Synthesize."
    • Positive Samples (2.5M) & Negative Samples (0.5M): The result of synthesis is the generation of 2.5 million "Positive Samples" and 0.5 million "Negative Samples." Positive samples refer to samples containing the target POI, while negative samples do not.
    • CoT corpus: These positive and negative sample pairs are organized into a "Chain-of-Thought corpus." According to the caption, these samples are "tri-view episodes" and are designed to "harden the system’s rejection capability under missing-target conditions." This means the dataset includes various scenarios where the target is present or absent, to train the model to better handle complex situations.
    • There is also an example image of a "Positive Sample" on the left, showing a street-view image with a blue trajectory, intuitively demonstrating what a positive sample looks like.

Next, let's look at the right section, which provides an example of a "Structured Sample":

  • Image Views: It displays three different views of an image: "Left View," "Front View," and "Right View." These images simulate the multi-view visual input a robot might observe in an environment.
  • Task Description (Mission): The task is "[POI Goal] Navigate to 'SUBWAY'," which means navigating to a "SUBWAY" (subway station).
  • Affordance Pixel: This specifies which pixel regions in each view are related to "affordance" or "target category." For example, in the front view, the pixel at coordinates [615, 753] is related to the target category (possibly referring to the general area of a subway entrance), while there are none in the left and right views (indicated by []).
  • Target Pixel: This specifies the specific pixel coordinates of the target "SUBWAY" in each view. For example, in the front view, the target pixel coordinates are [723, 522]. There are none in the left and right views (indicated by []).
  • Trajectory: In the front view, there is a blue curve (Trajectory) and a green dot, possibly indicating the robot's planned path or current position.
  • Annotations: The diagram also labels the meanings of "Affordance Pixel" and "Target Pixel," helping to understand how these coordinates are associated with the image content.

In summary, this diagram reveals the method for constructing the POI target corpus in the ABot-N1 approach: 1. First, generate precise pixel-level geometric annotations from POI images. 2. Then, use a fine-tuned VLM model to scale and filter large-scale in-the-wild data, obtaining high-quality valid data. 3. Finally, synthesize these valid data into a structured dataset containing positive and negative samples for training the model, particularly to enhance its robustness in situations where the target is missing. The entire process ensures the diversity and quality of the training data, providing a solid foundation for subsequent visual-language navigation tasks. The example on the right intuitively demonstrates the specific content and format of a structured sample, including multi-view images, task descriptions, target pixel locations, and related semantic information.

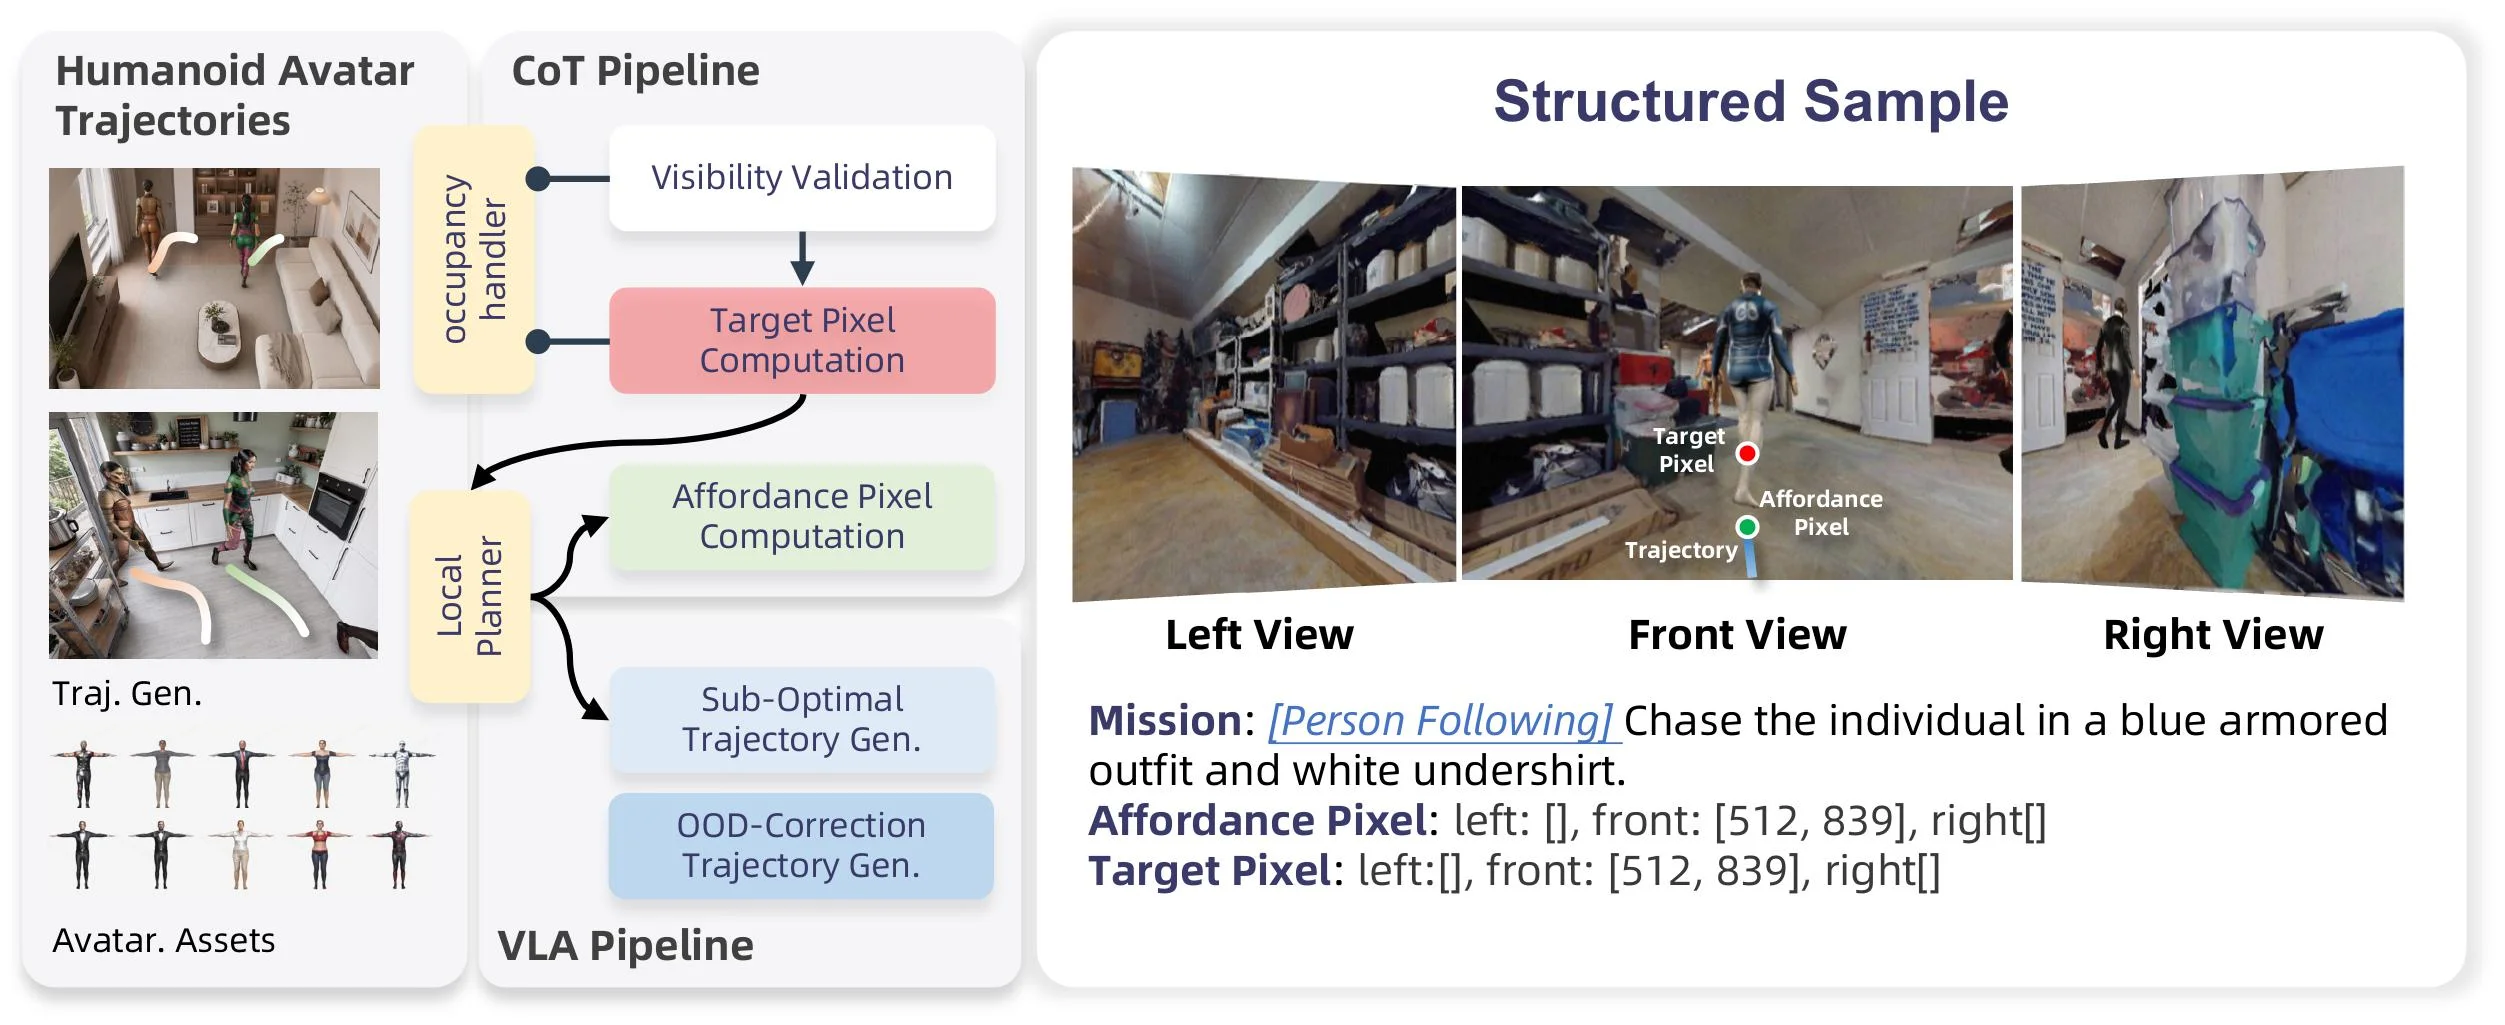
Figure 8 : Data Construction Pipeline for the Person-Following Corpus. Left: the data construction pipeline covering both CoT and VLN data. The pixel (CoT) data derives affordance and target pixels from human avatar trajectories through A ∗ waypoint planning, visibility detection, and stochastic prediction perturbation, while the VLN data comprises sub-optimal trajectory and OOD-correction trajectory synthesis. Right: an example structured sample showing tri-view observations with affordance and target pixel annotations, along with the language instruction specifying the target appearance.

This diagram (Figure 8) illustrates the data construction workflow for the "Person-Following Corpus," divided into two sections: the left workflow and the right structured sample example. We'll explain each part step by step:

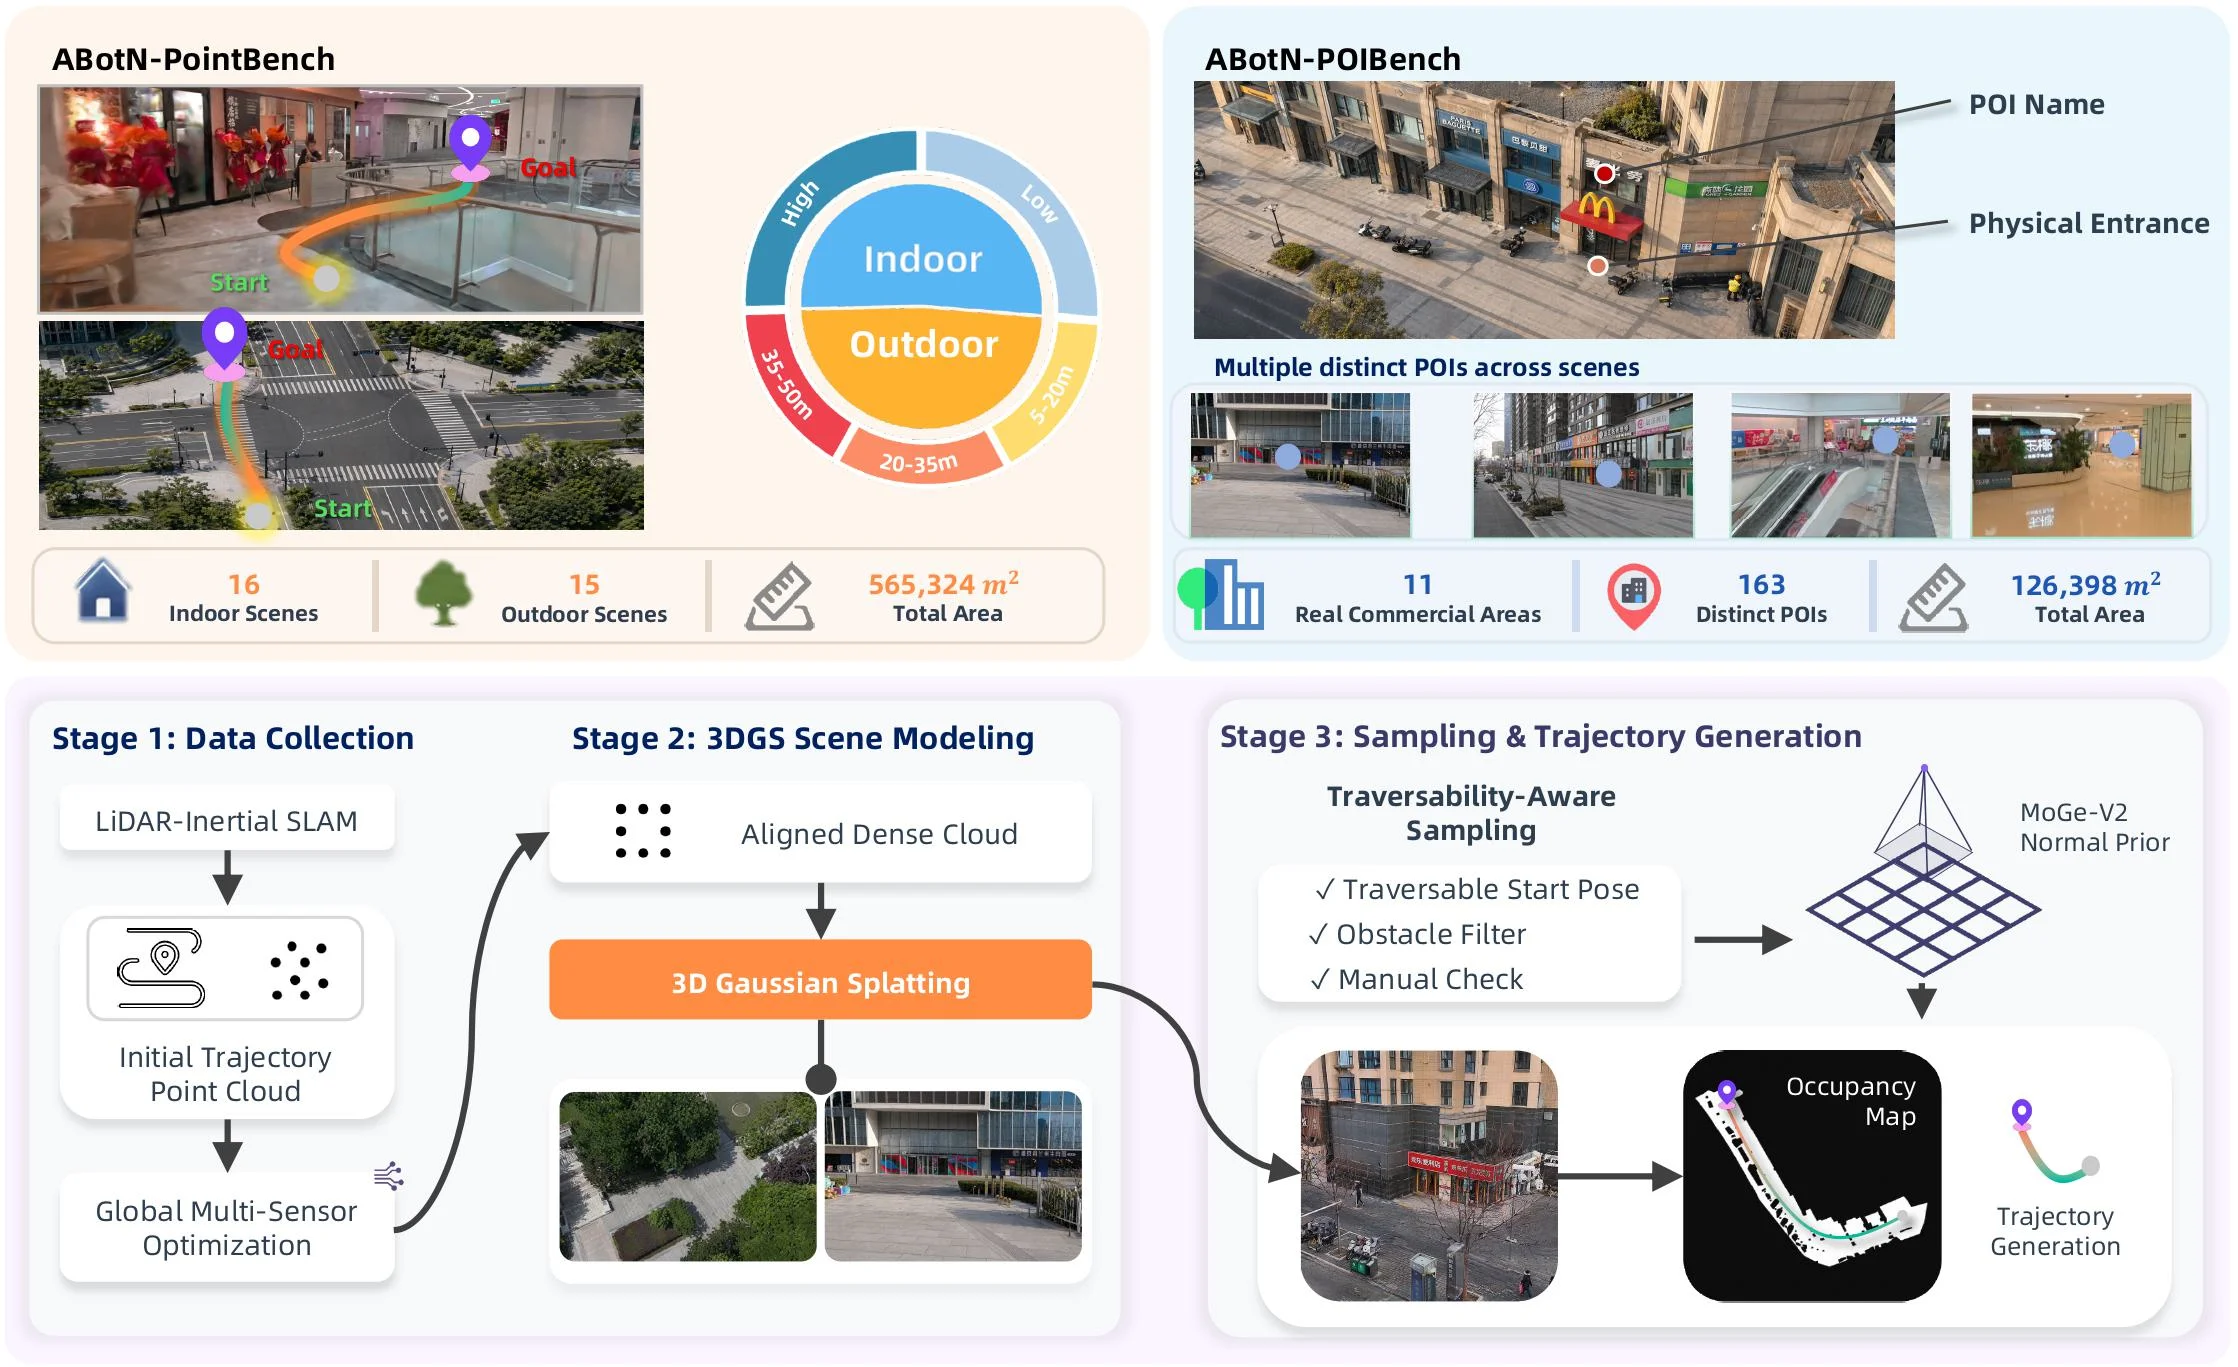
Figure 9 : Overview of the ABotN Benchmark Suites and their Unified Scene Construction Pipeline. Top: Dataset statistics and hierarchical distance splits for ABotN-PointBench (left) and ABotN-POIBench (right). Bottom: The unified three-stage generation pipeline: (1) high-fidelity data collection via LiDAR-inertial SLAM; (2) photorealistic 3DGS scene modeling initialized by aligned dense point clouds; and (3) traversability-aware query sampling and ground-truth reference trajectory generation using A ∗ {}^{\!*} on MoGe-V2-derived 2D occupancy grids.

This image is Figure 9 from the paper "ABot-N1: Toward a General Visual Language Navigation Foundation Model," titled "Overview of the ABotN Benchmark Suite and Its Unified Scenario Construction Pipeline." It is divided into two main sections, clearly illustrating the two key components of the ABotN benchmark (ABotN-PointBench and ABotN-POIBench) and their common, unified three-stage scenario construction process.

Upper Section: Dataset Statistics and Hierarchical Distance Division

This section presents two main benchmark datasets: ABotN-PointBench (left) and ABotN-POIBench (right), along with their statistics and some visual examples.

  • ABotN-PointBench (Top Left):

    • Visual Examples: Shows two images, representing indoor and outdoor navigation scenarios. Each image marks the "Start" and "Goal" points, connected by a colored path, intuitively illustrating the navigation task.
    • Data Statistics:
      • "16 Indoor Scenes": Indicates the dataset contains 16 indoor scenes.
      • "15 Outdoor Scenes": Indicates the dataset contains 15 outdoor scenes.
      • "565,324 m² Total Area": Indicates the total area of all scenes is 565,324 square meters.
    • Hierarchical Distance Division: A circular chart in the middle divides scenes into different hierarchical levels based on distance. The center shows "Indoor" and "Outdoor." Indoor scenes are further subdivided into distance ranges: "Low," "5-20m," "20-35m," and "35-50m." This indicates the dataset considers navigation tasks of varying difficulty.
  • ABotN-POIBench (Top Right):

    • Visual Examples: The top shows a street view image marking the "POI Name" (e.g., McDonald's) and "Physical Entrance." Below, four smaller images represent "Multiple distinct POIs across scenes."
    • Data Statistics:
      • "11 Real Commercial Areas": Indicates the dataset contains 11 real commercial areas.
      • "163 Distinct POIs": Indicates the dataset has 163 distinct points of interest.
      • "126,398 m² Total Area": Indicates the total area of all scenes is 126,398 square meters.

Lower Section: Unified Three-Stage Scenario Construction Pipeline

This part details the unified three-stage process used to build these benchmark scenarios, with arrows indicating the flow of data and processing.

  • Stage 1: Data Collection:

    • This is the starting point of the pipeline.
    • LiDAR-Inertial SLAM: Initially, LiDAR-Inertial SLAM (Simultaneous Localization and Mapping) technology is used. This is a core perception module for localization and mapping in the environment.
    • Initial Trajectory Point Cloud: The SLAM process generates an initial trajectory point cloud, which contains the robot's (or agent's) position information and the 3D structure of the environment as it moves.
    • Global Multi-Sensor Optimization: The initial trajectory point cloud undergoes global multi-sensor optimization. This step aims to improve data accuracy and consistency, possibly involving fusion of data from different sensors and global adjustments.
  • Stage 2: 3DGS Scene Modeling:

    • The goal of this stage is to create realistic 3D scene models.
    • Aligned Dense Cloud: An aligned dense point cloud is obtained from the optimized data of the first stage. This is the foundational data for 3D modeling.
    • 3D Gaussian Splatting: 3D Gaussian Splatting (3DGS) technology is used, an advanced rendering technique that generates high-quality, photorealistic 3D scene models from point cloud data.
    • Output Example: Shows two images of scenes modeled using 3DGS, which look very realistic with rich details.
  • Stage 3: Sampling & Trajectory Generation:

    • This stage focuses on sampling queries (such as start and goal points) from the constructed scenes and generating navigation trajectories.
    • Traversability-Aware Sampling: This is a key sampling step that considers environmental traversability.
      • √ Traversable Start Pose: Ensures the sampled start point is traversable.
      • √ Obstacle Filter: Applies an obstacle filter to exclude blocked or infeasible paths.
      • √ Manual Check: May also include manual checks to ensure data quality.
    • MoGe-V2 Normal Prior: This component likely provides a normal prior based on the MoGe-V2 model, aiding subsequent trajectory generation or scene understanding.
    • Occupancy Map: An occupancy grid map is generated from the sampled data and scene model. This is a 2D representation showing which areas of the environment are traversable (free space) and which are not (obstacles).
    • Trajectory Generation: Finally, continuous navigation trajectories are generated on the occupancy grid map. The image shows an example where a colored path (from start to finish) is planned on the occupancy grid map and corresponds to an actual scene image. This process likely uses an A algorithm or its variant (as mentioned in the image: A^! on MoGe-V2-derived 2D occupancy grids) to find the optimal path.

Summary and Methodology Understanding:

This image clearly reveals the construction process of the ABot-N benchmark and the philosophy behind it. The method creates high-quality benchmark datasets through a unified, three-stage pipeline: 1. Data Collection: Utilizes advanced SLAM technology to obtain accurate environmental perception data. 2. Scene Modeling: Uses 3D Gaussian Splatting technology to generate realistic 3D scenes from point cloud data, providing authentic visual input for navigation tasks. 3. Query Generation and Trajectory Planning: In the generated scenes, it considers environmental traversability, samples meaningful start and goal points, and generates navigation trajectories on the occupancy grid map.

This process ensures the diversity (e.g., ABotN-PointBench and ABotN-POIBench target different types of navigation tasks), realism (photorealistic modeling), and practicality (traversability-aware trajectory generation) of the benchmark dataset. In this way, researchers can evaluate the performance of visual language navigation models in various realistic and challenging scenarios. The arrows in the figure clearly indicate the flow of data from raw perception to final trajectory generation, showcasing the complete chain from data collection to scene modeling and then to task design.

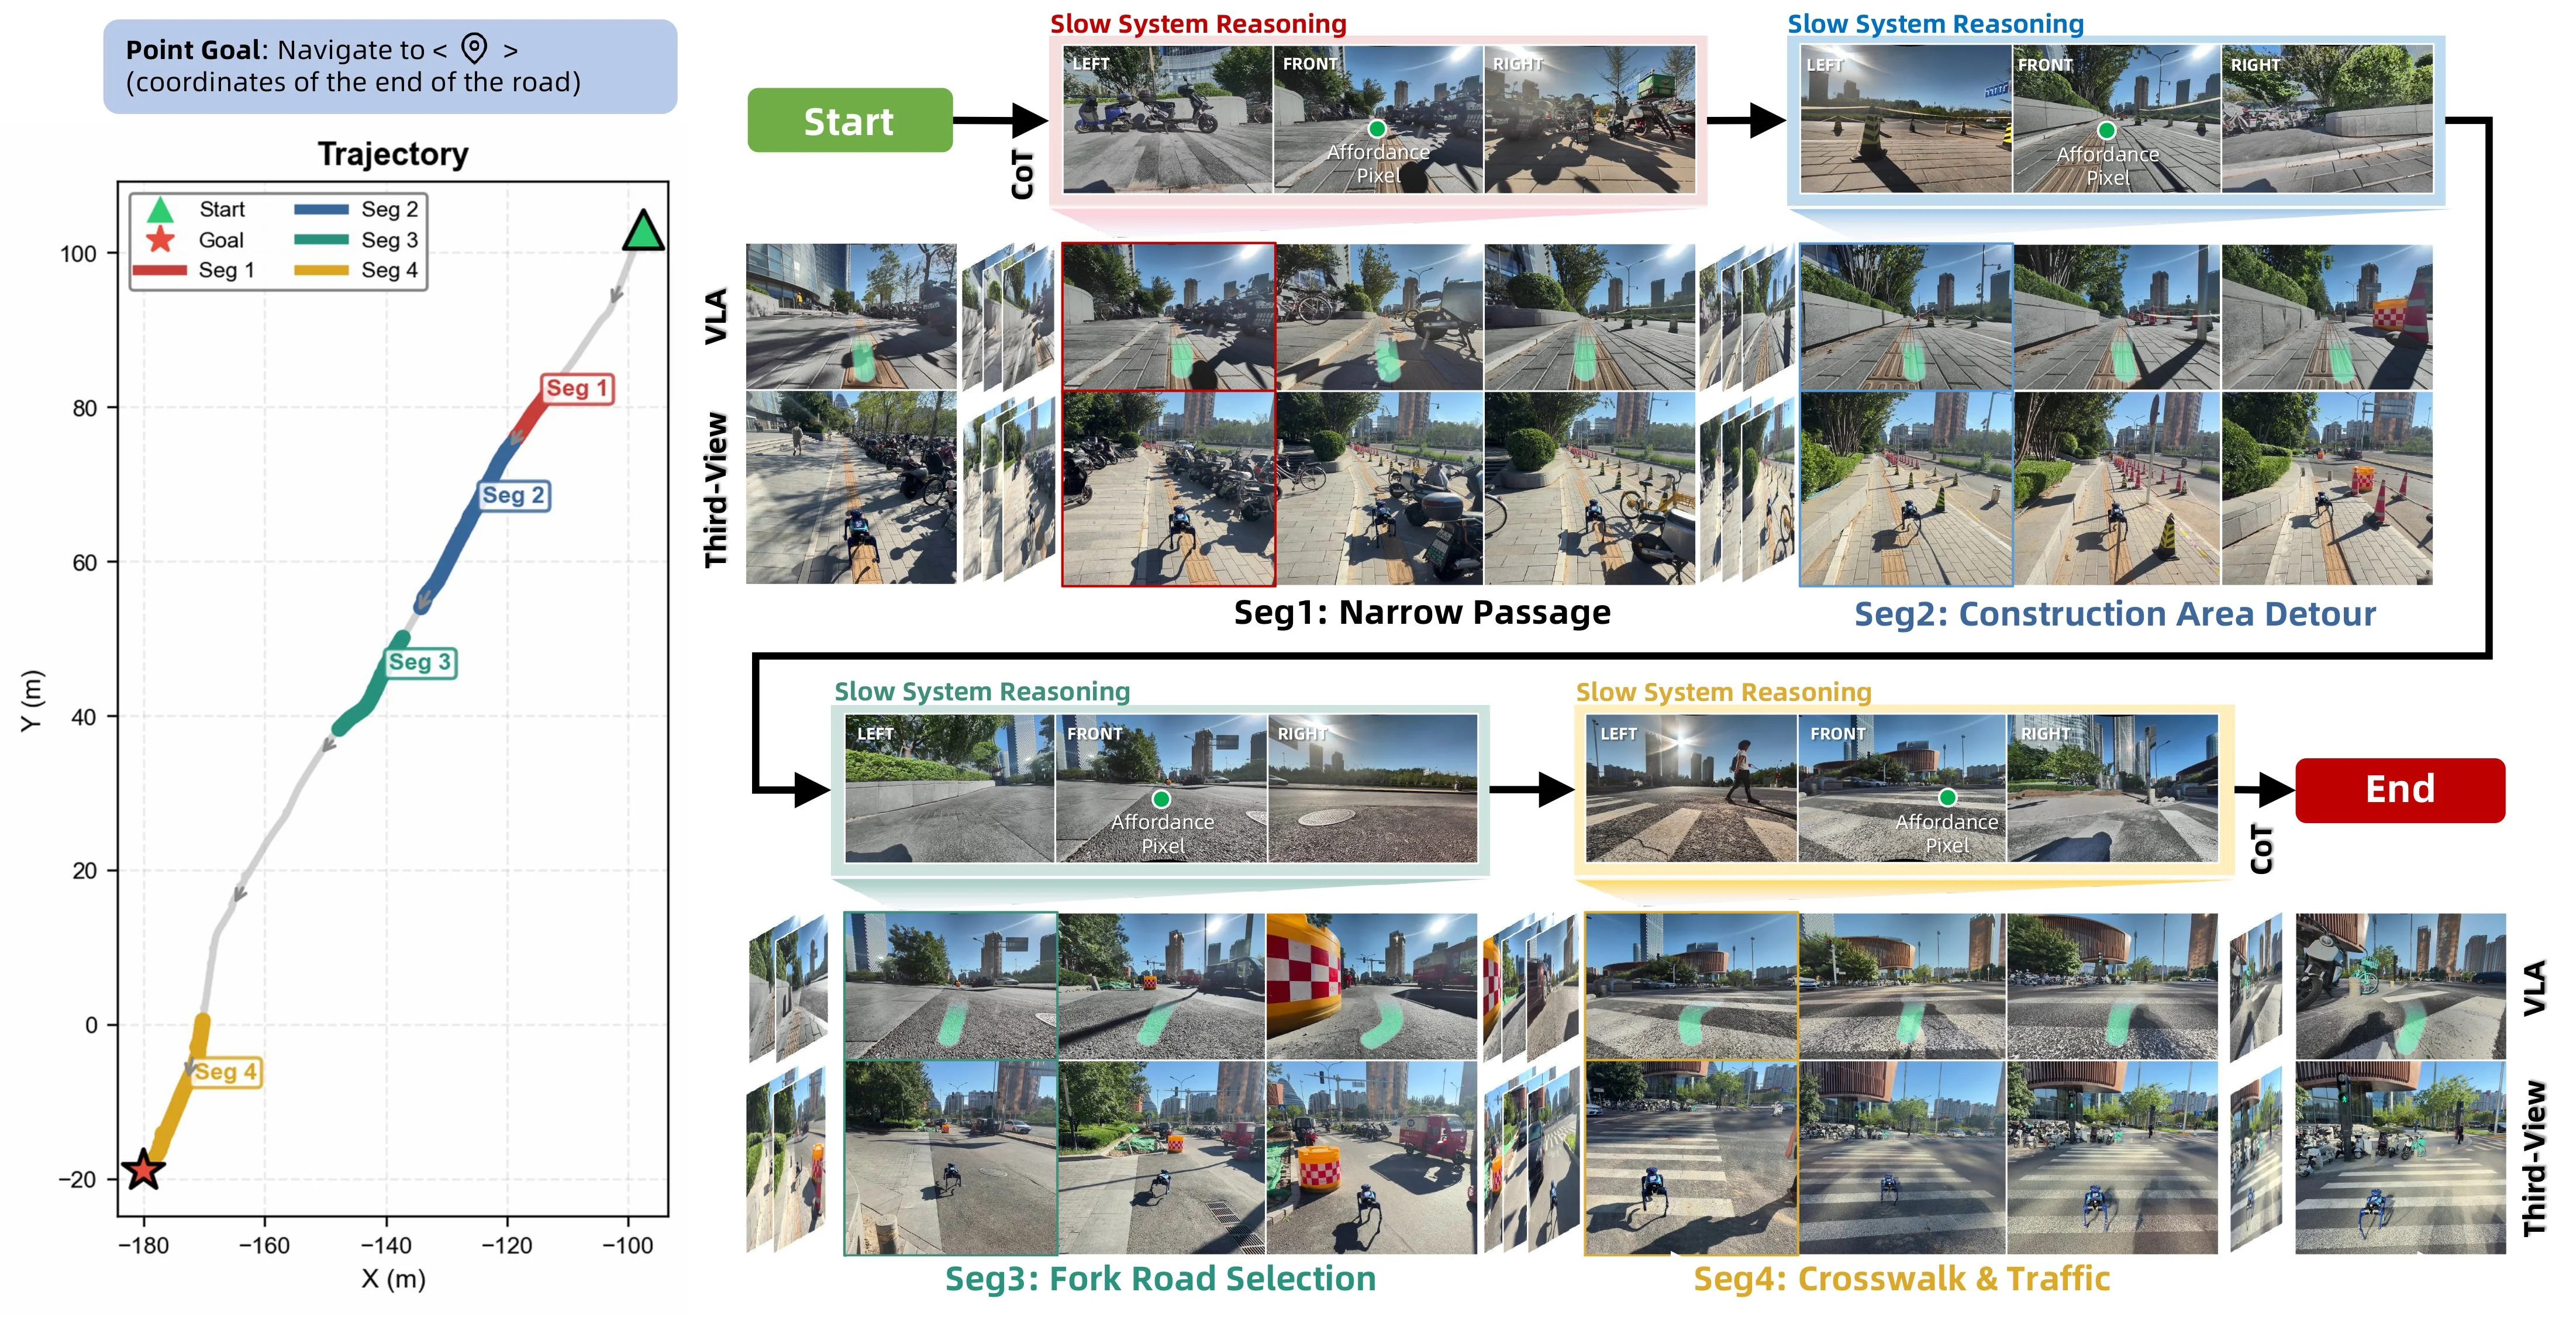
Figure 10 : Point-Goal Deployment. Four segments of a long-range outdoor episode showcasing obstacle avoidance on narrow roads, construction area detour, correct fork selection, and traffic-light-compliant crosswalk traversal.

This diagram illustrates the deployment process of the ABot-N1 model in a long-distance outdoor scene for point goal navigation. We can analyze the content and information flow of each part step by step from left to right and top to bottom:

Left Trajectory Map (Trajectory)

  • Axes: The horizontal axis is X (meters), and the vertical axis is Y (meters), representing the robot's position in a two-dimensional plane.
  • Path and Segments: The white curve is the robot's navigation trajectory, which is divided into four segments (Seg1 - Seg4), each marked with a different color:
    • Seg1 (red): Corresponds to the "Narrow Passage" scene. It is the first segment after the start of the trajectory, starting near the starting point (green triangle) and extending towards the middle.
    • Seg2 (blue): Corresponds to the "Construction Area Detour" scene. It comes after Seg1 and continues to extend towards the target direction.
    • Seg3 (green): Corresponds to the "Fork Road Selection" scene. After Seg2, the trajectory has a branch selection part.
    • Seg4 (yellow): Corresponds to the "Crosswalk & Traffic" scene. It is the last segment of the trajectory, leading to the end point (red five - pointed star, the target point, with coordinates at the end of the road).
  • Legend: The green triangle is the starting point (Start), the red five - pointed star is the target point (Goal), and line segments of different colors represent different navigation segments (Seg1 - Seg4).

Right - side Process and Scene Display (from Start to End)

  • Start (green button): The starting point of the navigation task, where the robot starts to execute the navigation task.
  • Slow System Reasoning:
    • This part is the "slow thinking" stage of the model, where explicit Chain - of - Thought (CoT) reasoning is carried out, and at the same time, an affordance pixel (the position marked by the green dot in the figure) is generated. This affordance pixel is an anchor point in the image space, used to guide subsequent actions.
    • Each slow reasoning stage has three - perspective images: LEFT (left), FRONT (front), and RIGHT (right), showing the robot's visual input at this stage. For example, in the slow reasoning stage of Seg1, the three - perspective images show the scene around the narrow passage, and the green dot marks the passable affordance pixel.
  • VLA (Visual - Language - Action? Or visual - language - anchor? Combined with the context, it should be anchor guidance based on visual - language) and Third - View:
    • The VLA part shows the robot's actual visual perception at this stage (it may be the robot's own perspective or a multi - perspective splicing), and the Third - View is the scene display from a third - party perspective, which helps to understand the robot's surrounding environment.
    • Each segment (Seg1 - Seg4) has corresponding VLA and Third - View images:
      • Seg1: Narrow Passage: The image marked with a red box shows the scene of the narrow passage, and the robot needs to pass through a limited space. The images at the upper part (slow reasoning stage) and the lower part (VLA and Third - View images) show how the robot reasons and acts in this scene.
      • Seg2: Construction Area Detour: The image marked with a blue box shows the scene of the construction area, and the robot needs to detour. The images at the upper part (slow reasoning stage) and the lower part (VLA and Third - View images) show how the robot identifies the construction area and chooses a detour path.
      • Seg3: Fork Road Selection: The image marked with a green box shows the scene of the fork road, and the robot needs to choose the correct road. The images at the upper part (slow reasoning stage) and the lower part (VLA and Third - View images) show how the robot reasons and chooses in this scene.
      • Seg4: Crosswalk & Traffic: The image marked with a yellow box shows the scene of the crosswalk and traffic, and the robot needs to follow traffic rules (such as stopping at a red light and going at a green light? The figure may show the situation of traffic lights) to pass the crosswalk. The images at the upper part (slow reasoning stage) and the lower part (VLA and Third - View images) show how the robot reasons and acts in this scene.
  • CoT (Chain - of - Thought): There is a CoT label next to some slow reasoning stages, indicating that the model carries out explicit chain - of - thought reasoning at this stage to make decisions.
  • End (red button): The end point of the navigation task, where the robot reaches the target point (red five - pointed star) and completes the task.

Summary of the Method Operation Process

  1. Task Start: The robot starts from the starting point (Start) and enters the "Slow System Reasoning" stage.
  2. Slow System Reasoning:
    • The model carries out explicit CoT reasoning to analyze the current scene (through the image input of the three perspectives: LEFT, FRONT, and RIGHT).
    • An affordance pixel is generated, which is an anchor point in the image space. This anchor point is a compact set of points in the image space, used to guide subsequent actions. It is a general interface connecting high - level intentions and low - level control.
  3. Action Execution and Scene Perception (VLA and Third - View):
    • The fast action expert uses text clues (target task, such as the coordinates of point goal navigation) and the guidance of the affordance pixel to generate continuous waypoints (at the native control frequency).
    • The VLA and Third - View images show the robot's actual visual perception and surrounding environment at this stage, helping to understand how the robot acts in specific scenes (such as passing through a narrow passage, detouring around a construction area, choosing a fork road, passing a crosswalk, etc.).
  4. Task End: The robot reaches the end point (End) and completes the task.

Results and Conclusions (Inferred from the Figure)

  • The figure shows the successful navigation process of the ABot - N1 model in four different navigation scenes (narrow passage, construction area detour, fork road selection, crosswalk & traffic), indicating that the model can handle diverse outdoor navigation tasks.
  • By generating an affordance pixel through slow system reasoning and combining it with the action generation of the fast action expert, the model can make reasonable decisions in different scenes, avoid obstacles, detour construction areas, choose the correct fork road, follow traffic rules to pass crosswalks, and finally reach the target point.
  • This slow - fast architecture (decoupling cognition from control via a slow - fast architecture) is guided by dual visual - language signals, ensuring the robustness, generalization, and interpretability of navigation. Because the explicit CoT of slow system reasoning and the anchor of the affordance pixel provide a clear decision - making process and target guidance.

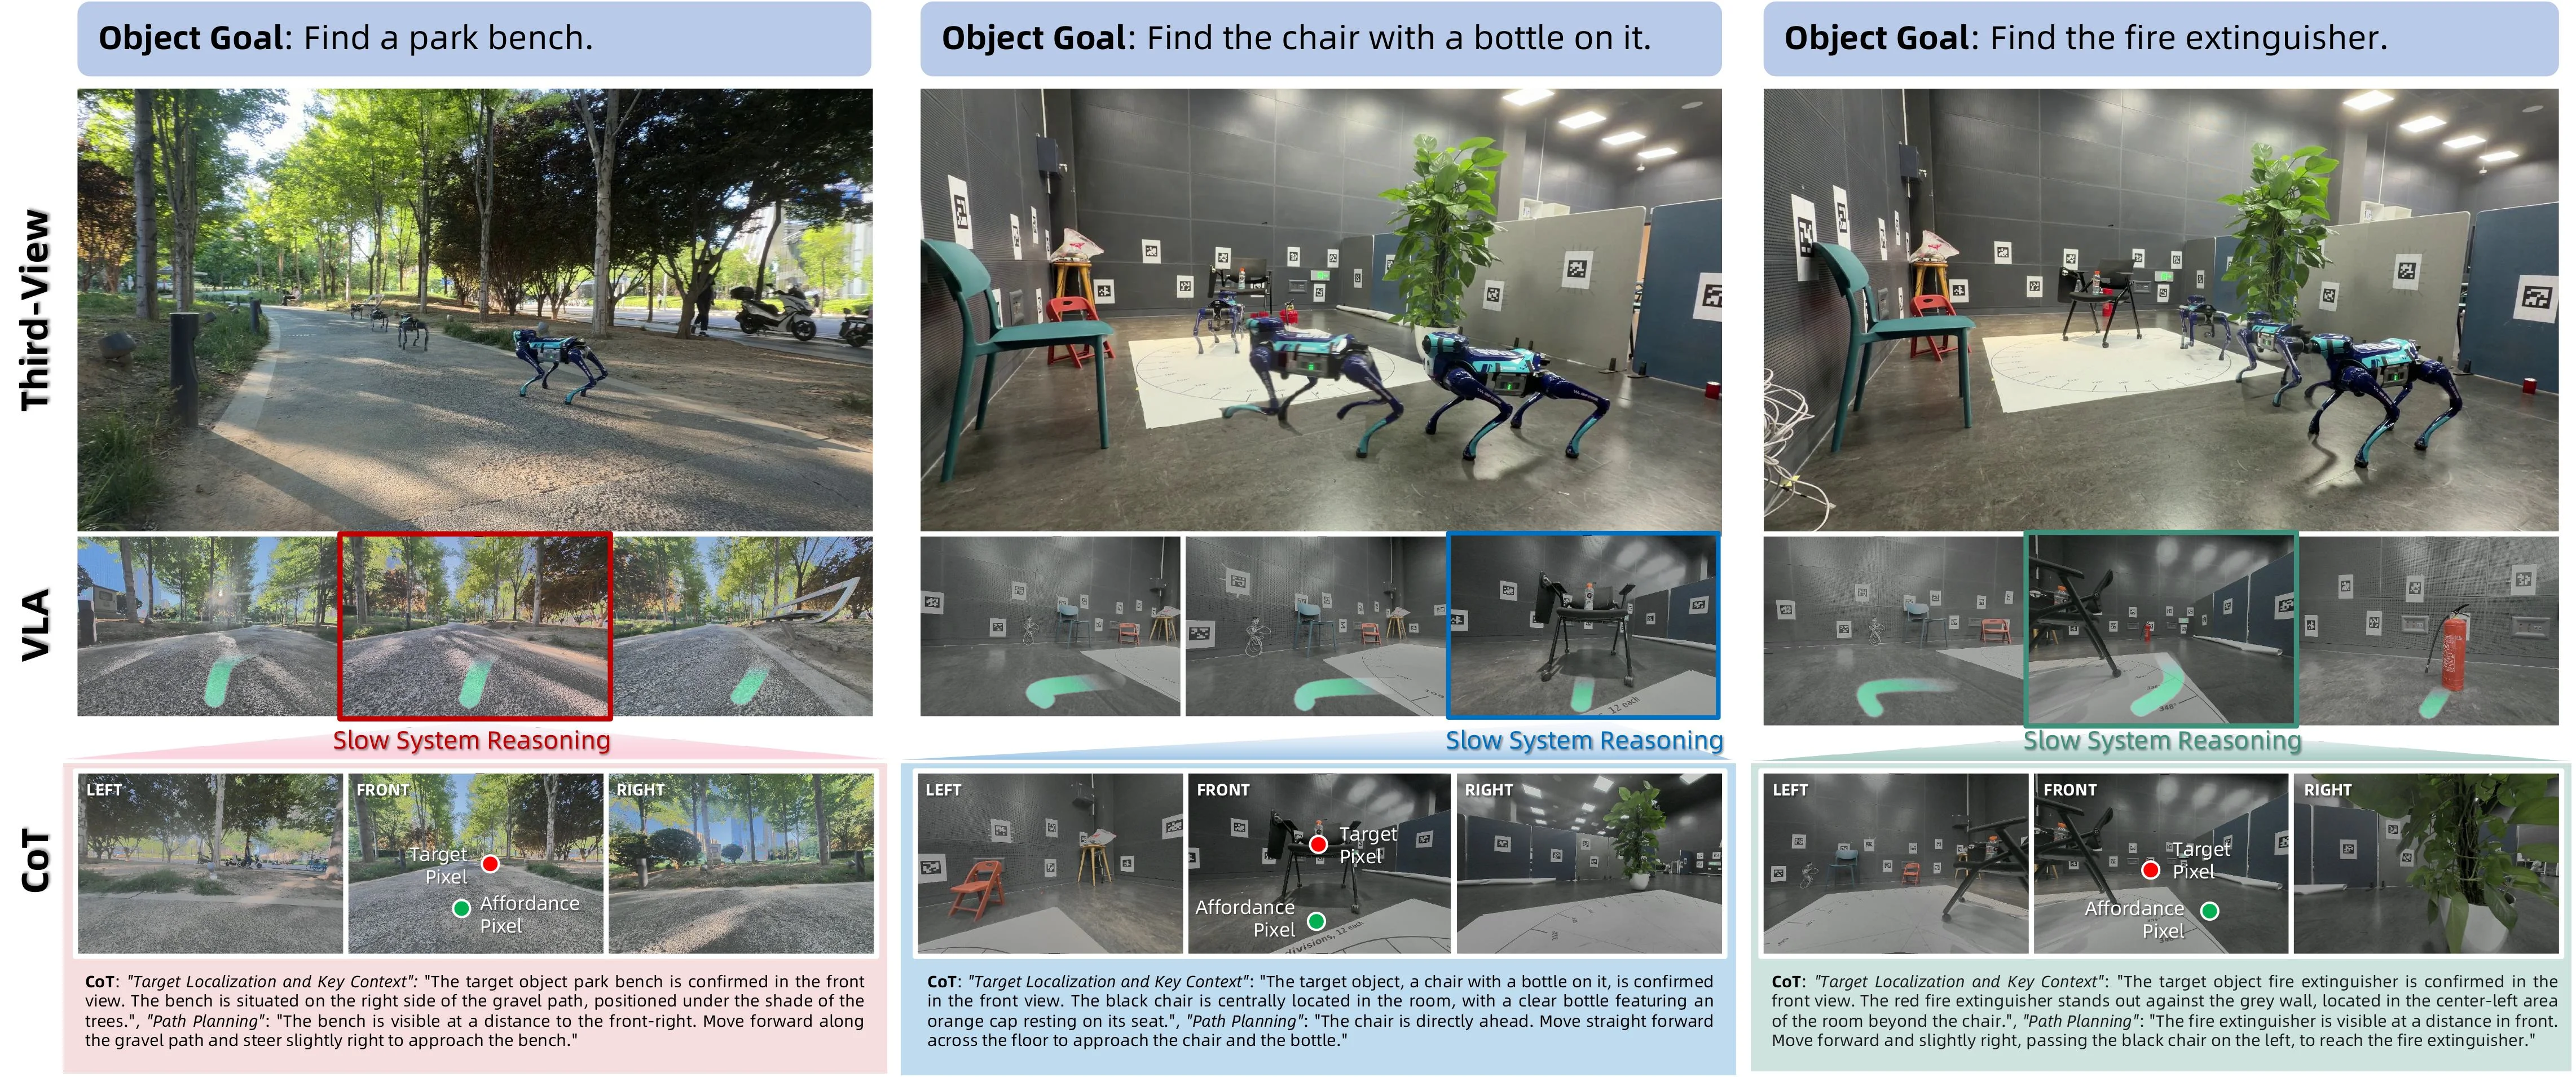
Figure 11 : Object-Goal Deployment. Three cases—outdoor bench under dappled tree shade at long range, indoor chair with a water bottle (spatial reasoning), and partially occluded fire extinguisher—with CoT, affordance, and target pixel overlays.

This figure demonstrates the deployment of ABot - N1 in object - goal navigation tasks, with three core cases (outdoor bench, indoor chair with a bottle, partially occluded fire extinguisher). It explains how the model combines visual - language signals to complete navigation through the process of "slow system reasoning → pixel goal generation → fast action expert execution". Here's the breakdown from components, information flow, and method logic:

1. Components and Information Flow (from left to right, top to bottom)

  • Top - layer (Object Goal): Clearly defines the goal of each case (e.g., "find a park bench", "find a chair with a bottle", "find a fire extinguisher"), setting the "high - level intention" of the task.
  • Third - View (third - person perspective): Shows the global view of the real - world scene, helping to understand the environment where the robot (quadruped robot) moves. This is the "real - world background" of the task.
  • VLA (Visual - Language Alignment or intermediate visual representation): Contains multiple sub - figures, with regions marked by red/blue/green boxes labeled "Slow System Reasoning". This part is the core output of visual - language reasoning: The slow system performs explicit Chain - of - Thought (CoT) reasoning through visual - language signals (image + text prompts) to locate the pixel position of the target object ("Target Pixel") and the "Affordance Pixel" (possibly a pixel related to task - relevant interactable/key context, e.g., the shaded area of the bench, the position of the chair, the position of the fire extinguisher).
  • CoT (Chain - of - Thought): The text box below each case explains the reasoning process in detail:
  • Target localization (e.g., "the bench is on the right side of the gravel road, under the shade of trees");
  • Key context (e.g., "the chair is in the center of the room, with a bottle with an orange cap on the seat");
  • Path planning (e.g., "move forward along the gravel road, adjust the direction slightly to approach the bench").
    This part is explicit linguistic reasoning, transforming visual information into interpretable decision - making logic and solving the problem of "black - box mapping".

2. How the Method Works (Logic from Reasoning to Action)

ABot - N1 adopts a "slow - fast" architecture, separating "cognition (reasoning)" from "control (action)":
- Slow System (Slow System Reasoning): Performs explicit CoT reasoning through visual - language signals (image + text prompts) and outputs pixel - level targets (Target Pixel) and key context pixels (Affordance Pixel). This step refines the "high - level intention", transforming the vague task goal (e.g., "find a bench") into a specific pixel position (image - space anchor) and providing a "universal interface" for subsequent actions.
- Fast Action Expert: Uses the pixel target and text clues output by the slow system to generate continuous waypoints at the native control frequency to drive the robot's movement. The movement trajectory of the robot in the figure (e.g., the change of the robot's position in Third - View) verifies this process: Starting from the initial position, according to the pixel target and path planning, it gradually approaches the target object.

3. Results and Conclusions (Effectiveness from Cases)

The three cases correspond to target difficulties of different levels (long - range, spatial reasoning, partial occlusion). The model's performance can be verified in the following ways:
- Target Localization Accuracy: The "Target Pixel" and "Affordance Pixel" in CoT accurately cover the target object (e.g., the bench under the shade, the chair with a bottle, the fire extinguisher), indicating that the slow - system reasoning can effectively locate the target.
- Path Planning Rationality: The path planning description (e.g., "move forward along the gravel road", "move straight to approach the chair") is consistent with the robot's movement direction in Third - View, indicating that the fast - action expert can generate a reasonable action path according to the pixel target and text clues.
- Generality and Robustness: The three cases cover scenarios such as outdoor, indoor, and occlusion, and the model can complete the task in all of them. This proves the generality of ABot - N1 in diverse tasks (point - goal, object - goal, instruction - following, etc.). Through explicit reasoning (CoT) and pixel anchors, it solves the problems of "coordinate drift" and "poor handling of long - tail semantics" and realizes robust, interpretable, and general navigation.

In short, this figure clearly shows the working process of ABot - N1: "visual - language reasoning (slow system) → pixel goal → action execution (fast system)". The slow system uses CoT to explicitly reason and locate the target pixel, and the fast system uses pixels and text clues to generate an action path. Finally, it achieves object - goal navigation in different scenarios, verifying the generality, robustness, and interpretability of the method.

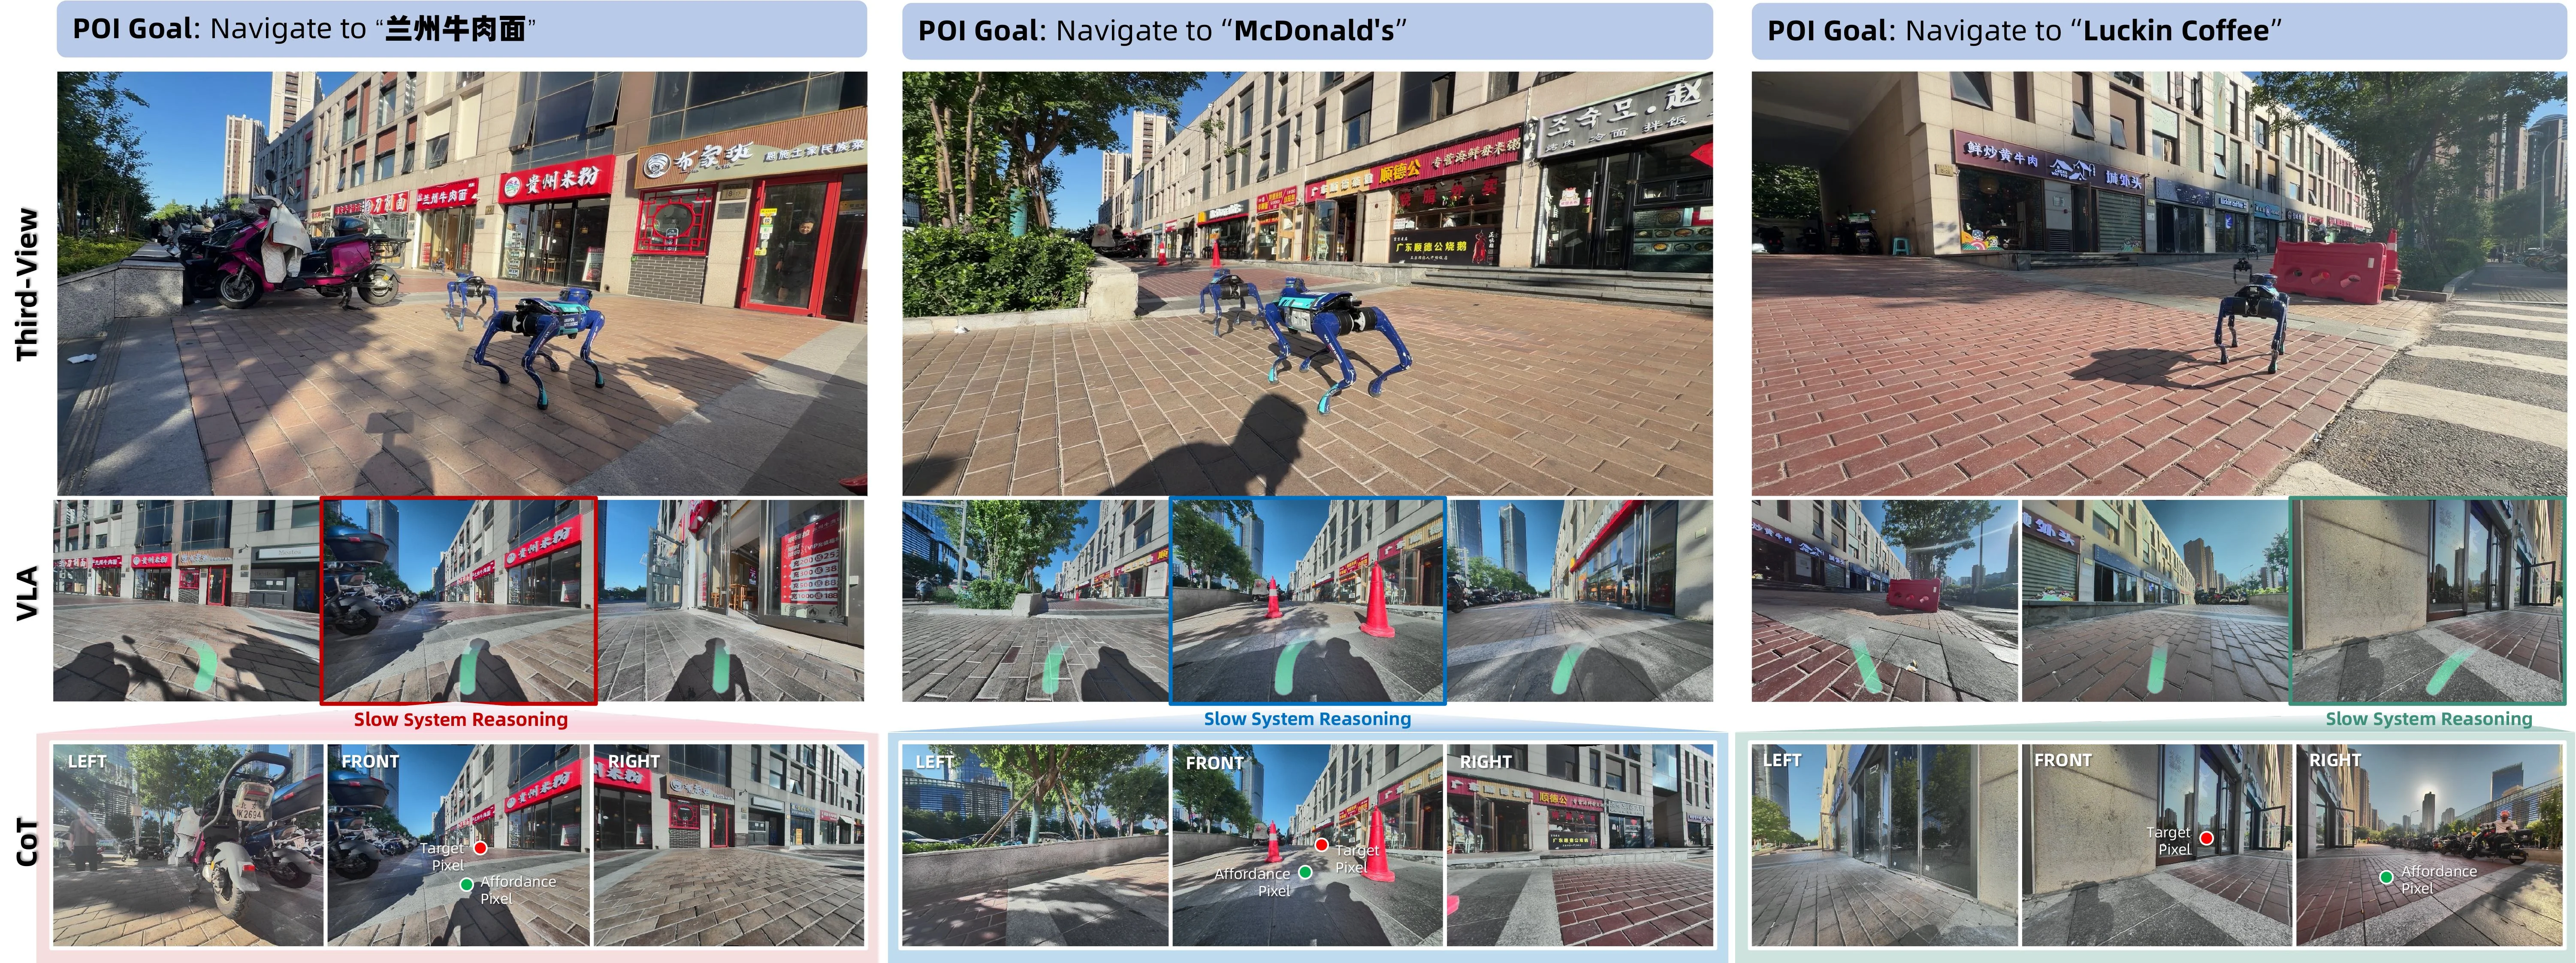
Figure 12 : POI-Goal Deployment. Locating a Lanzhou noodle restaurant (large viewing angle), McDonald’s (obstacle avoidance en route), and Luckin Coffee (slope navigation and staircase avoidance).

This diagram illustrates the deployment of the ABot-N1 model in POI (Point of Interest) target navigation tasks, showcasing the model's cognitive reasoning and control execution processes for three different POI targets: "Lanzhou Beef Noodles," "McDonald's," and "Luckin Coffee." It explains the specific workings of the method.

Overall Structure and Information Flow

The diagram is divided into three columns, each corresponding to a POI target (from left to right: "Lanzhou Beef Noodles," "McDonald's," "Luckin Coffee"). Each column contains three parts: Third-View (third-person perspective), VLA (intermediate representation of visual-language reasoning), and CoT (chain-of-thought reasoning and pixel-target generation). Information flows from scene observations at the top, through intermediate reasoning stages, to the generation of control-oriented pixel targets and action commands, reflecting the "perception-reasoning-control" process.

Component Meanings and Processes (Column-by-Column Analysis)

First Column: POI Target is "Lanzhou Beef Noodles"

  • Third-View: Displays the robot's (quadruped robot) position in an actual street scene, with surrounding elements like shops (e.g., "Lanzhou Beef Noodles" sign), electric bikes, etc. This is the raw visual observation received by the model, providing overall spatial information about the scene.
  • VLA: Contains multi-perspective images (similar to multi-frame or multi-view visual inputs), with the area marked by a red box being the focus of "Slow System Reasoning." This area concentrates on visual content containing the target (Lanzhou Beef Noodles shop) for explicit chain-of-thought (CoT) reasoning to identify the target's location and related environmental features (e.g., shop sign, surrounding obstacles).
  • CoT: Displays images from LEFT, FRONT, and RIGHT perspectives, showing how the model processes visual information from different directions during reasoning. It marks "Target Pixel" (red dot) and "Affordance Pixel" (green dot), indicating that the model determines the target's location (target pixel) and passable areas (affordance pixel) through CoT reasoning. These pixel-level anchors serve as a "universal interface" connecting high-level intent (finding the target shop) with low-level control (generating a walking path).

Second Column: POI Target is "McDonald's"

  • Third-View: Shows the robot in a street scene with surrounding shops (possibly with "McDonald's"-related signs or shops in the target area), traffic cones, and other obstacles. The raw observation provides scene information containing the target (McDonald's) and obstacles.
  • VLA: Multi-perspective images with the area marked by a blue box being the focus of "Slow System Reasoning." It concentrates on visual content containing the target (McDonald's) and obstacles (traffic cones) to reason about how to avoid obstacles and find the target.
  • CoT: Displays images from LEFT, FRONT, and RIGHT perspectives, marking "Target Pixel" (red dot) and "Affordance Pixel" (green dot). The model determines the target's location and passable areas while considering obstacle avoidance (traffic cones). The generated pixel anchors guide the subsequent action expert to generate continuous waypoints.

Third Column: POI Target is "Luckin Coffee"

  • Third-View: Shows the robot in a street scene with surrounding shops (possibly with "Luckin Coffee"-related signs or shops in the target area), ramps, stairs, and other environmental elements. The raw observation provides scene information containing the target (Luckin Coffee) and terrain/obstacles.
  • VLA: Multi-perspective images with the area marked by a green box being the focus of "Slow System Reasoning." It concentrates on visual content containing the target (Luckin Coffee) and terrain features (ramps, stair entrances) to reason about ramp navigation and stair avoidance.
  • CoT: Displays images from LEFT, FRONT, and RIGHT perspectives, marking "Target Pixel" (red dot) and "Affordance Pixel" (green dot). The model determines the target's location and passable areas (considering ramp and stair avoidance). The generated pixel anchors are used to control the robot's movement.

Method Operation Mechanism (Revealed from the Diagram)

ABot-N1 adopts a slow-fast architecture: 1. Slow System Reasoning: Executed by a visual-language reasoner, it uses explicit chain-of-thought (CoT) reasoning to analyze the target (POI) and environmental features (e.g., obstacles, terrain) in the scene, generating Target Pixel and Affordance Pixel. This step is the "cognitive" phase, converting high-level visual-language instructions (e.g., "navigate to Lanzhou Beef Noodles") into image-space anchors. It addresses issues like coordinate drift and poor long-tail semantic handling in traditional methods, as explicit reasoning and pixel-level anchors provide more robust and interpretable spatial decisions. 2. Fast Action Expert: Utilizes the pixel anchors (target pixel and affordance pixel) and text prompts (e.g., POI name) generated by slow system reasoning to generate continuous waypoints at a local control frequency. This is the "control" phase, converting high-level intent (finding the target) into low-level action commands to ensure the robot moves accurately in the real environment.

Results and Conclusions (Inferred from the Diagram)

The diagram shows the model's successful deployment in three different POI target scenarios: - For "Lanzhou Beef Noodles" (wide-angle scene): The model can identify the target shop's location, and the generated pixel anchors guide the robot's navigation in a scene with obstacles like electric bikes. - For "McDonald's" (obstacle avoidance): The model can identify the target and avoid obstacles like traffic cones, demonstrating the method's effectiveness in obstacle avoidance tasks. - For "Luckin Coffee" (ramp and stair avoidance): The model can identify the target and handle terrain features (ramps, stairs), showing the method's effectiveness in terrain navigation tasks.

By connecting high-level intent (visual-language instructions) with low-level control (action generation guided by pixel anchors) through pixel-level anchors and explicit language traces (chain-of-thought reasoning), ABot-N1 achieves robust, generalizable, and interpretable navigation. It performs excellently in simulated and real-world benchmarks, setting new state-of-the-art records (as stated in the abstract). This method addresses issues like coordinate drift, poor long-tail semantic handling, and lack of interpretability in traditional methods, providing an effective architecture for visual-language navigation foundation models.

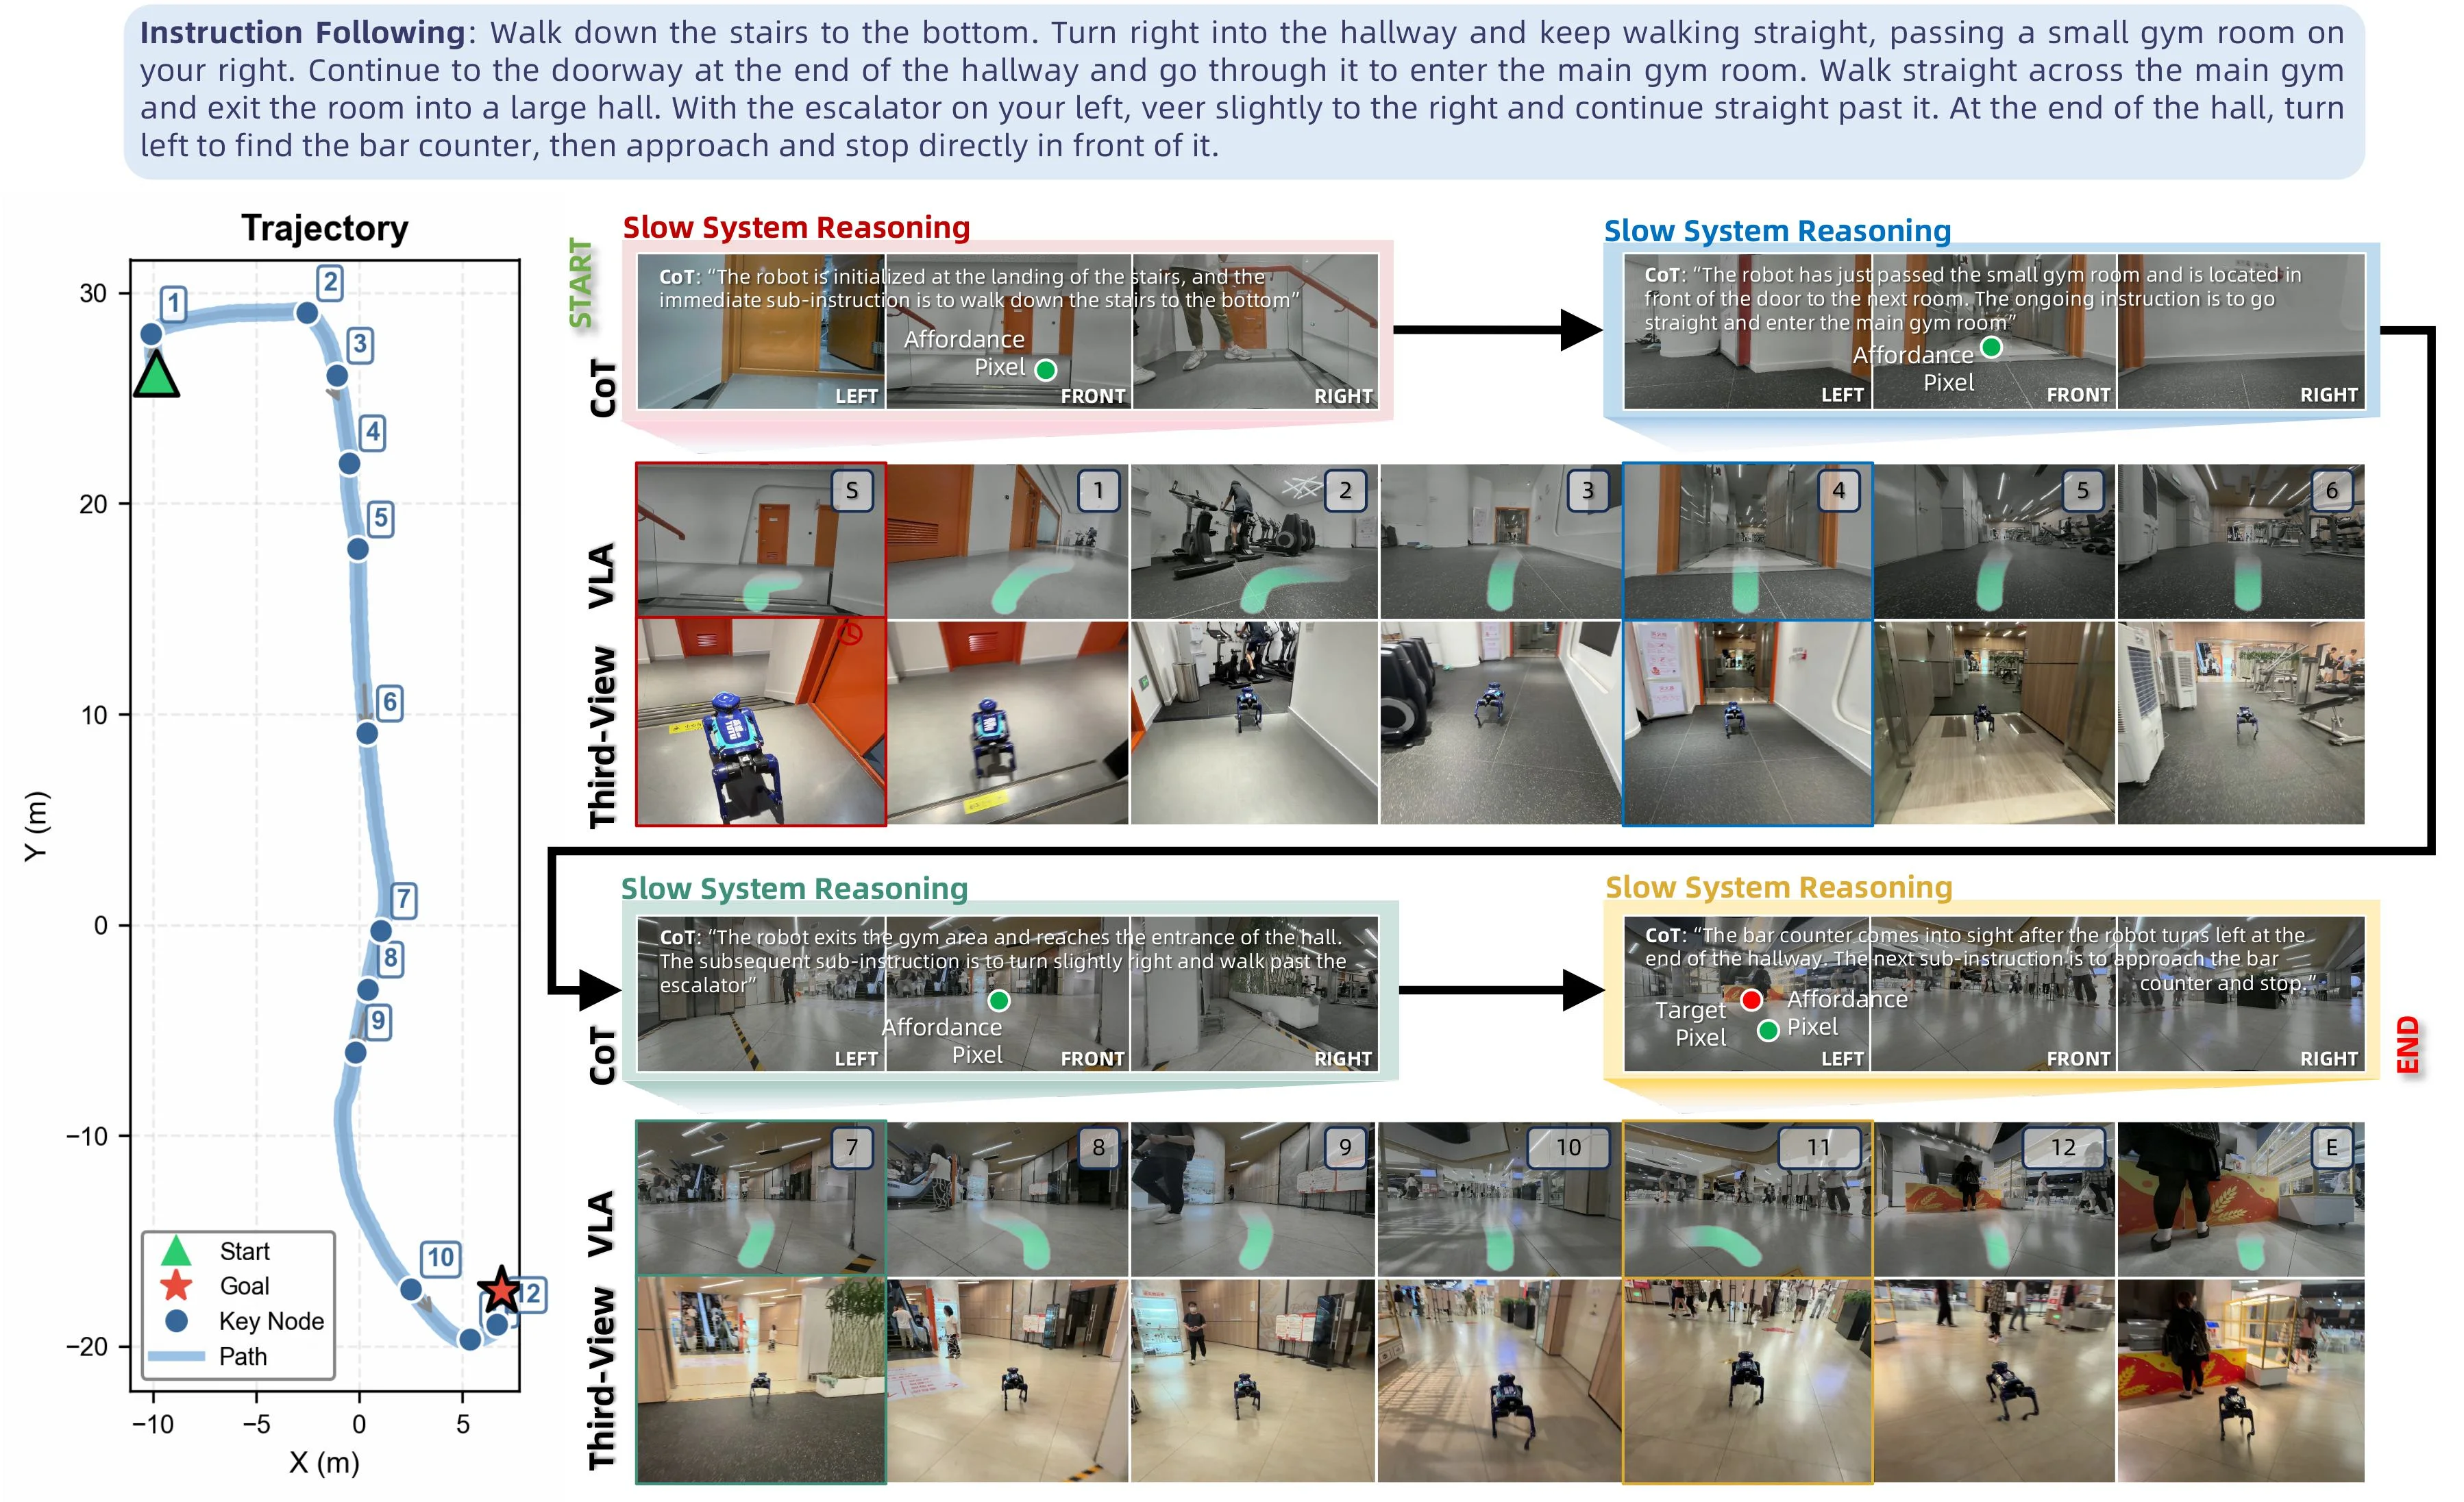
Figure 13 : Instruction-Following Deployment. Slow-system reasoning at four critical moments—stair descent, gym entry, gym exit, and bar approach—with CoT, affordance pixel, and target pixel visualizations.

This diagram illustrates the deployment process of the ABot-N1 model in instruction-following tasks, clearly presenting the operational mechanism of the method:

Left Trajectory Graph

  • This is a two-dimensional coordinate graph (with units in meters for the X and Y axes), showing the path of the robot from the starting point (green triangle "Start") to the target point (red five-pointed star "Goal").
  • The blue dots are "Key Nodes" (numbered from 1 to 12), representing important positions of the robot during the navigation process; the blue curve is the "Path", connecting these key nodes and showing the robot's movement trajectory.

Middle and Right Sections: "Slow System Reasoning" and "Third-View VLA"

The diagram shows the "Slow System Reasoning" (at four key moments in chronological order, connected by arrows) and the corresponding "Third-View VLA" (Third-Person Perspective Visual-Language-Action? Or Visual-Language-Anchor? Combining the context, VLA may be Visual-Language-Anchor Visualization): 1. Stair Descent Moment: - "Slow System Reasoning" Section: It includes "CoT" (Chain-of-Thought, i.e., the text description of the model's reasoning process), "Affordance Pixel" (possibly the spatial region that the model focuses on, marked by green dots) and perspective views from left, front, and right. Here, the CoT explains that the robot's initial position is on the stair platform, and the current sub-instruction is to walk down the stairs to the bottom. - "Third-View VLA" Section: The upper part is the image from the robot's perspective (with a green trajectory? Possibly the path predicted by the model), and the lower part is the image of the robot from the third-person perspective. The red box marks the robot's position and the surrounding environment at this key moment, corresponding to the early key nodes in the trajectory graph (such as near nodes 1 - 5). 2. Gym Entry Moment: - "Slow System Reasoning": The CoT explains that the robot has just passed a small gym and is directly in front of the door of the next room. The current instruction is to walk straight into the main gym. Similarly, there are Affordance Pixels and perspective views. - "Third-View VLA": The blue box marks the robot's position at this moment (near nodes 5 - 6 in the trajectory graph). The upper part is the image from the robot's perspective, and the lower part is the third-person perspective, showing the robot's process of entering the gym. 3. Gym Exit Moment: - "Slow System Reasoning": The CoT points out that the robot has left the gym area and reached the entrance of the hall. The subsequent sub-instruction is to turn slightly to the right and walk through the escalator. There are Affordance Pixels and perspective views. - "Third-View VLA": The green box marks the robot's position at this moment (near nodes 7 - 9 in the trajectory graph), showing the scene of the robot entering the hall from the gym. 4. Bar Approach Moment: - "Slow System Reasoning": The CoT explains that the bar comes into view after the robot turns left at the end of the corridor. The next sub-instruction is to approach the bar and stop. Here, there is a "Target Pixel" (marked by a red dot for the target position) and perspective views. - "Third-View VLA": The yellow box marks the robot's position at this moment (near nodes 11 - 12 in the trajectory graph), showing the process of the robot approaching and reaching the bar, and finally reaching the target (END).

Information Flow and Method Operation Logic

  • Information Flow: Starting from the starting point of the left trajectory graph, the robot moves step by step according to the instructions. Each key moment (stair descent, gym entry, gym exit, bar approach) triggers "Slow System Reasoning". The slow system reasoning clarifies the current task and sub-instructions through Chain-of-Thought (CoT), and at the same time identifies "Affordance Pixel" (affordable region, i.e., the spatial position that needs to be focused on) or "Target Pixel" (target position). Then, "Third-View VLA" visualizes this process from both the third-person perspective and the robot's own perspective, helping to understand the robot's position and actions in the environment. Finally, these high-level reasonings (slow system) are passed to the "fast action expert" (not directly shown in the diagram, but according to the paper abstract, it will use text clues and pixel guidance to generate continuous waypoints), thus controlling the robot's movement and completing the navigation from the starting point to the target.
  • Method Operation Mode: ABot-N1 works through a "slow-fast" architecture. The "slow system" is responsible for explicit Chain-of-Thought reasoning and generating pixel-level targets (such as affordable pixels or target pixels) as a common interface for different tasks (including point targets, object targets, interest point targets, instruction following, and human following, etc.). The "fast system" (action expert) uses text clues and pixel guidance to generate continuous waypoints at the native control frequency. It connects high-level intentions and low-level control through pixel anchors (pixel-level targets) and explicit language traces (Chain-of-Thought reasoning), ensuring the robustness, generalizability, and interpretability of navigation.

Results and Conclusions (Inferred from the Diagram)

  • The diagram shows the process of the robot successfully navigating from the starting point to the target (the bar). The slow system reasoning at each key moment correctly identifies the task and spatial position, and the third-person perspective visualization also shows that the robot is moving on the correct path. This indicates that the method of ABot-N1 can handle long-instruction navigation tasks, make correct spatial decisions in different environmental scenarios (stairs, gym, hall), and verify its generality, robustness, and interpretability. For example, it correctly identifies the task of going downstairs during stair descent, correctly identifies the direction and target area during gym entry and exit, and correctly identifies the target position and stops when approaching the bar.

This diagram visually and in detail shows the cognitive (slow system reasoning) and control (action execution, reflected through VLA visualization) processes of ABot-N1 in instruction-following tasks, clearly explaining how the method transforms high-level language intentions into low-level navigation actions while ensuring the accuracy and interpretability of navigation.

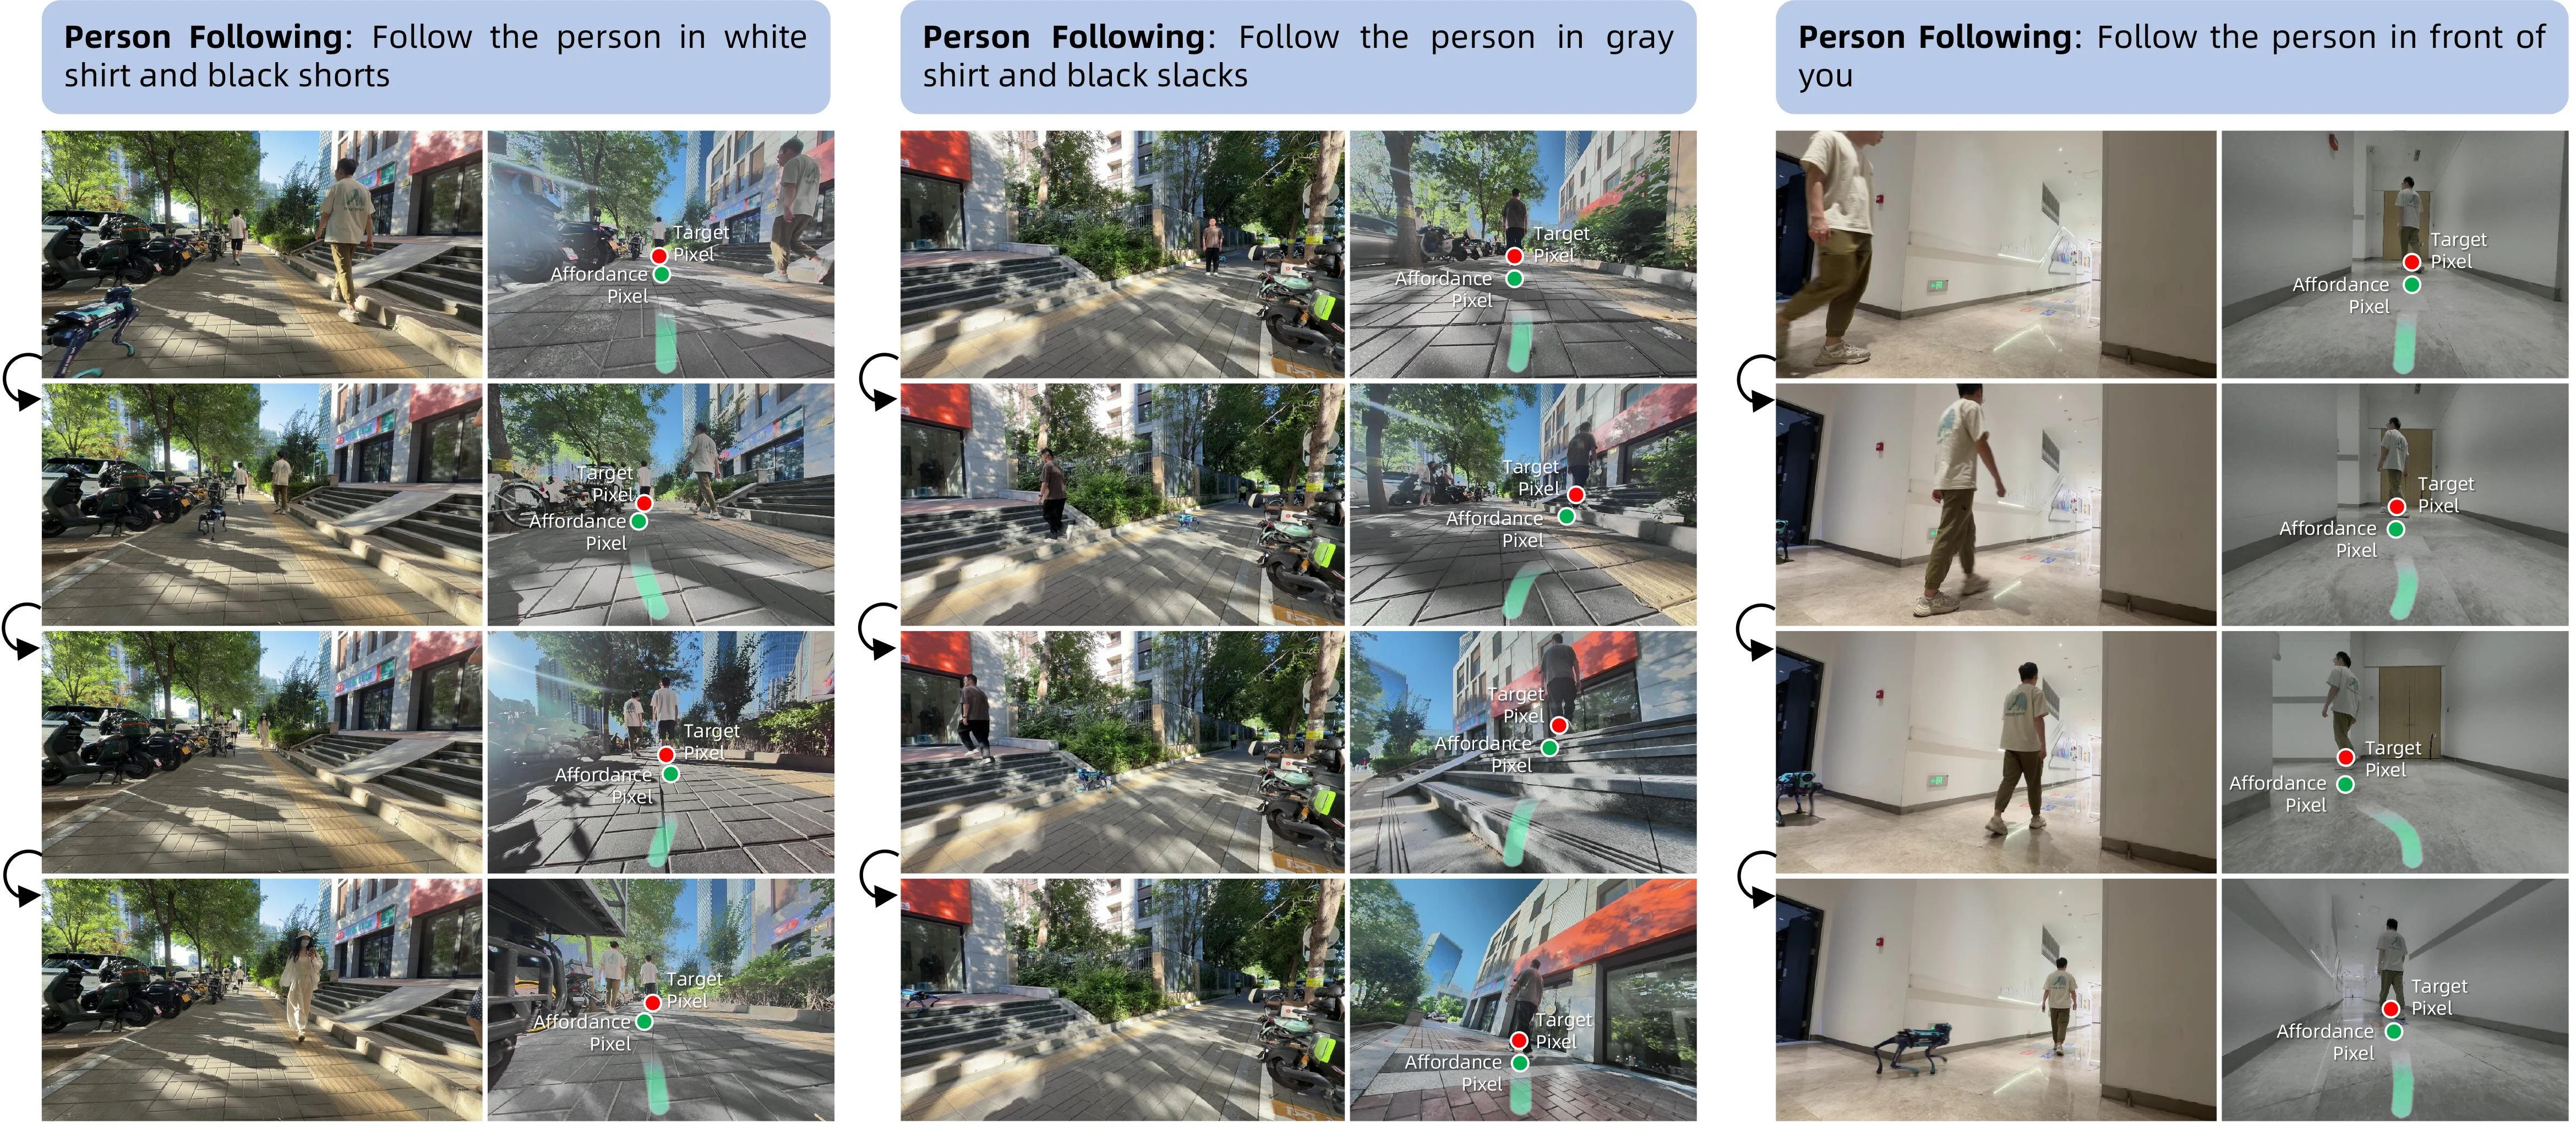
Figure 14 : Person-Following Deployment. Outdoor tracking under pedestrian distraction, stair-climbing following, and indoor corner-rounding with temporary occlusion.

This diagram illustrates the deployment of the ABot-N1 model in the "person following" task, divided into three main sections corresponding to different following scenarios: tracking under outdoor pedestrian interference, following while climbing stairs, and temporary occlusion tracking during indoor turns.

Section Structure and Component Meanings

  • Title of Each Section: The blue title bar at the top of each section clarifies the task objective of that section. For example, "Person Following: Follow the person in white shirt and black shorts," "Follow the person in gray shirt and black slacks," and "Follow the person in front of you." These titles define the specific target object or scenario for the current task.
  • Image Sequence and Arrows: The images within each section are arranged in a grid, and the black arrows on the left indicate the temporal order or task execution process, showing different stages of task execution from top to bottom (or left to right, depending on the layout). For instance, in the first section, the images from top to bottom demonstrate the model's tracking process of the person in white shirt and black shorts at different time steps.
  • Target Pixel (Red Dot): In the sub-image on the right of each image, the red dot marks the position of the target person (or the object to be followed). This shows the position of the target identified by the model in the image space.
  • Affordance Pixel (Green Dot): The green dot in the right sub-image marks the position that the model considers "reachable" or "actionable," usually related to the model's action planning, indicating the position to move to next.
  • Green Path (Trajectory of Affordance Pixel): The green dashed or solid line in the right sub-image represents the model's action trajectory, i.e., the path from the current position to the target position (or the next reachable position). This shows the result of the model's motion planning.

Revelation of How the Method Works

The ABot-N1 method handles the person following task through a "slow-fast" architecture: 1. Slow Vision-Language Reasoner: First, the model performs explicit "Chain-of-Thought" reasoning to analyze the current environment and task objective (e.g., identifying the person to follow). This stage generates a "pixel target" (i.e., the red dot in the figure) as a high-level intention representation. This pixel target is a universal interface applicable to multiple tasks (such as point target, object target, person following, etc.). 2. Fast Action Expert: Then, the model uses text prompts (task instructions) and the pixel target (red dot) to generate continuous waypoints (i.e., the green dots and paths in the figure), which are used at the local control frequency. This stage converts the high-level intention (pixel target) into low-level control signals (action trajectory), ensuring that the model can accurately follow the target.

Results and Conclusions

  • Scenario Coverage: The figure shows three different scenarios:
  • Outdoor Pedestrian Interference: The model can track the target even when there are other pedestrians (for example, in the first section, although there are other pedestrians, the model can still track the person in white shirt and black shorts).
  • Climbing Stairs: The model can track the target while climbing stairs (for example, in the second section, the target person climbs stairs, and the model can also follow).
  • Indoor Turns and Temporary Occlusions: The model can handle temporary occlusions when turning indoors (for example, in the third section, the target person turns or is partially occluded, and the model can still track).
  • Conclusion: These results show that the ABot-N1 can effectively perform the person following task in diverse environments (outdoor, indoor, with interference, with occlusions), verifying its robustness and generalization ability. By decoupling high-level cognition (slow reasoning) from low-level control (fast actions) and combining pixel anchors and explicit language traces, the model achieves robust, generalizable, and interpretable navigation.
← → flip · ↑ ↓ scroll notes · Esc exit