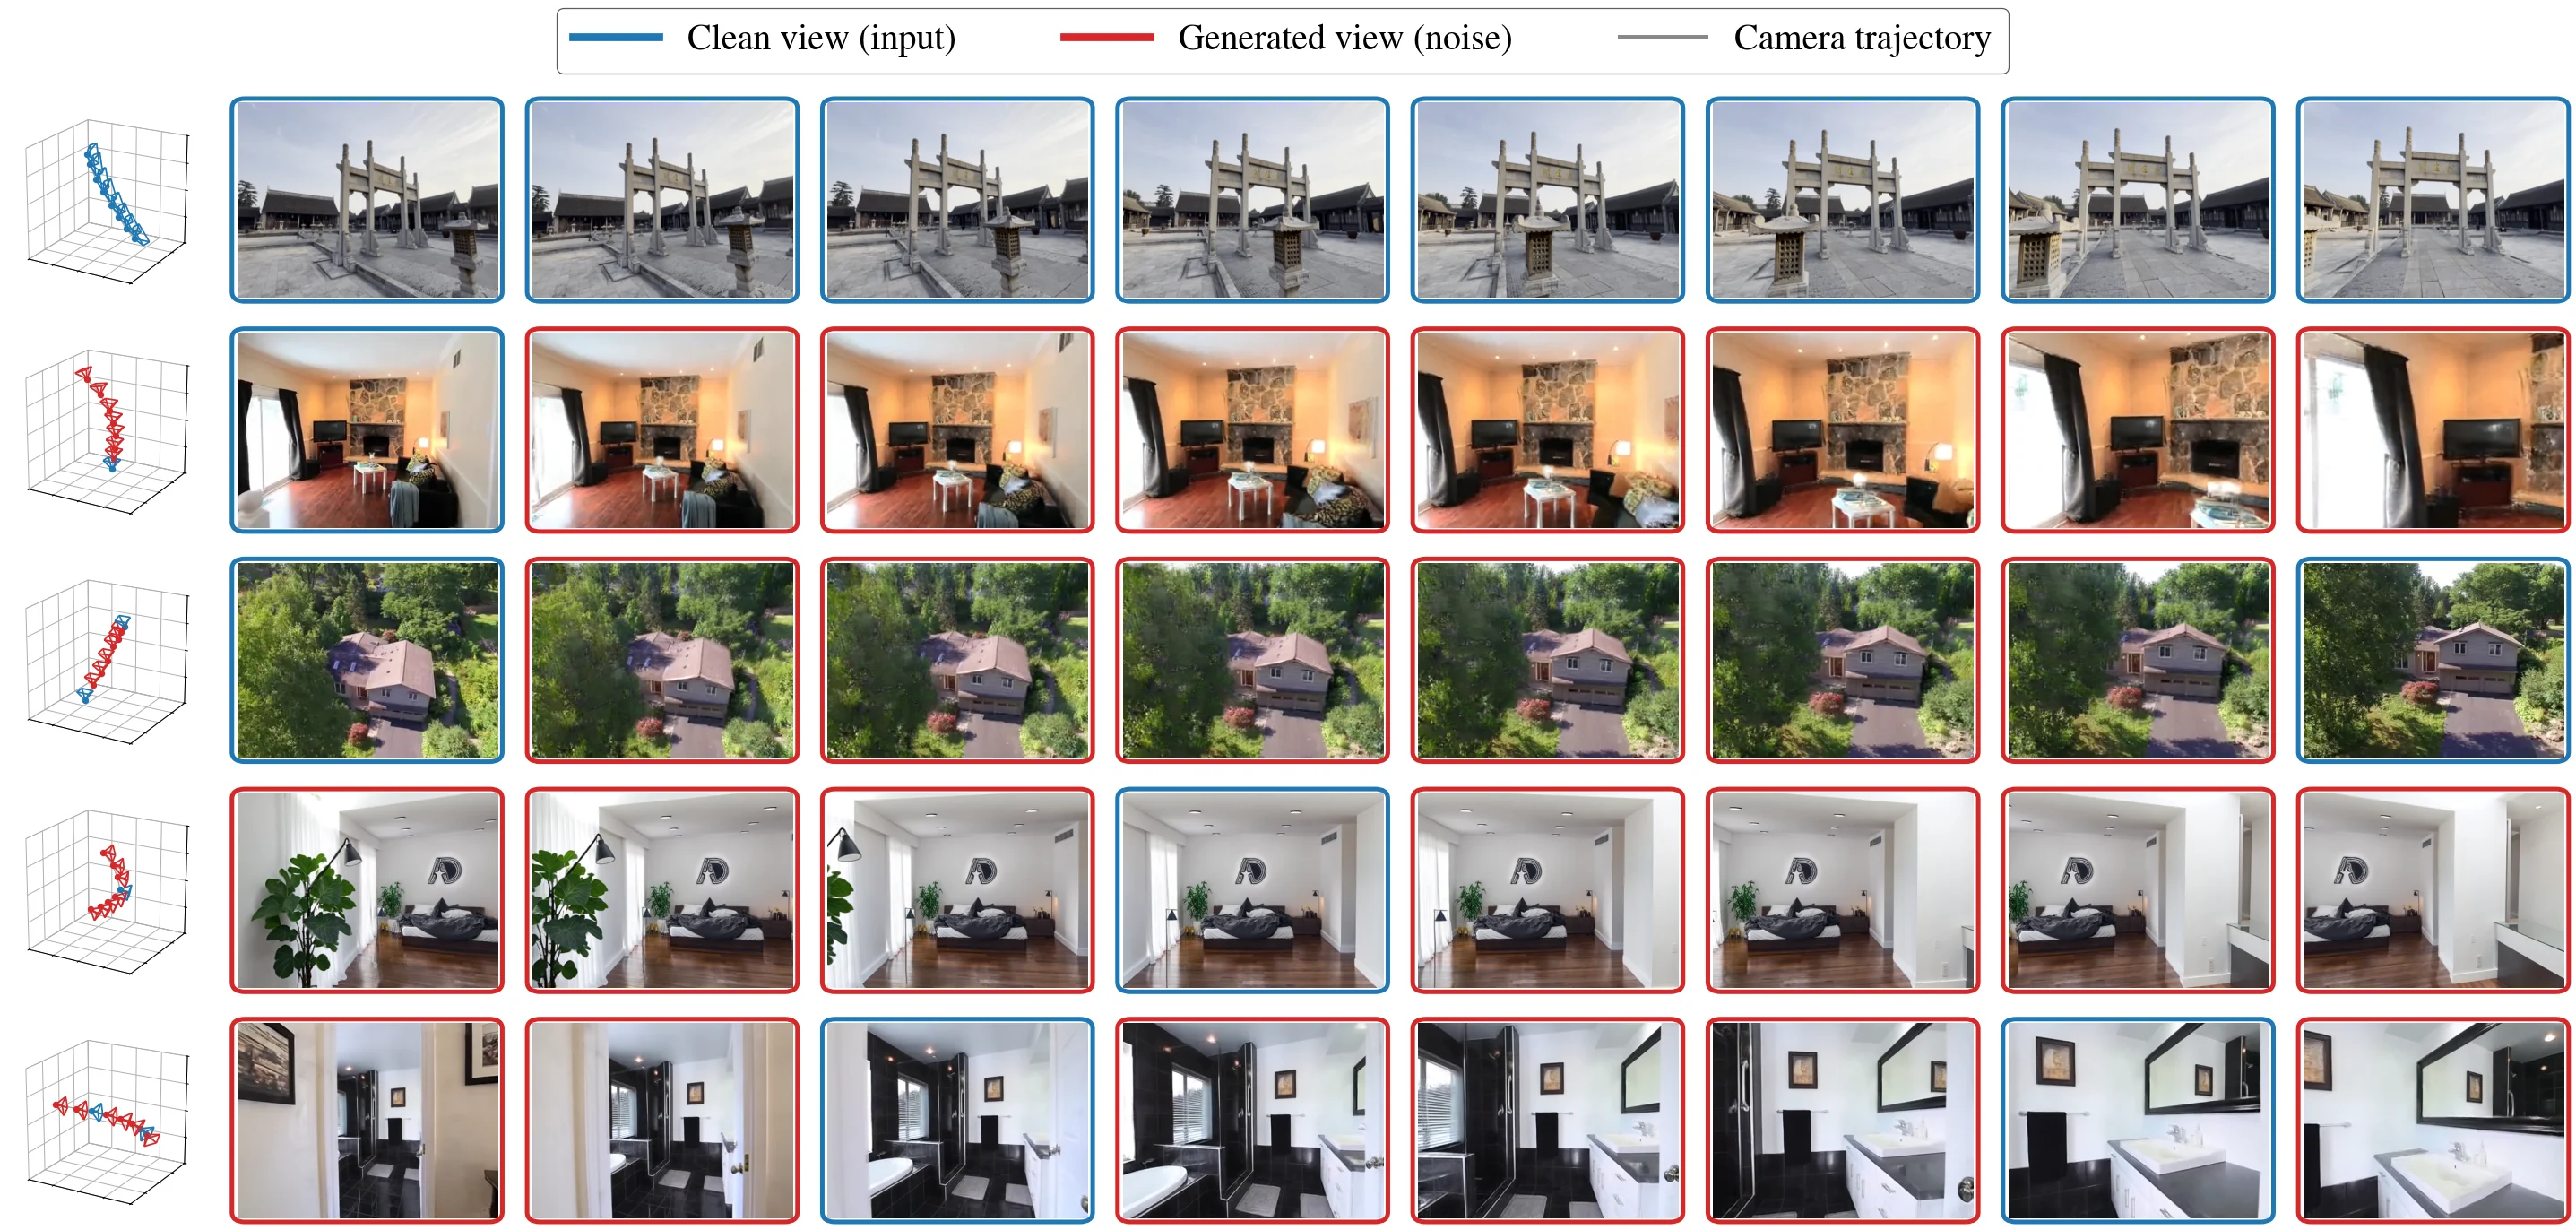
Table 2: Quantitative comparison on single-image 3D scene generation, averaged. Results on RealEstate10K (Zhou et al. , 2018 ) and DL3DV-10K (Ling et al. , 2024 ) under the 1-view setting, averaged over First Frame and Bidirectional configurations. Best in bold ; second best underlined . Table 3: Quantitative comparison on two-view 3D scene generation, averaged. Results on RealEstate10K (Zhou et al. , 2018 ) and DL3DV-10K (Ling et al. , 2024 ) under the 2-view setting, averaged over Interpolation and Extrapolation configurations. Best in bold ; second best underlined . Table 4: Quantitative comparison on the WorldScore benchmark (Duan et al. , 2025 ) . We report all seven official metrics together with their average. Bold and underline indicate the best and the second-best results, respectively. Figure 3: Visualization of PixWorld under different settings. PixWorld flexibly handles both 3D reconstruction and generation: when all input views are clean, it performs reconstruction; when clean and noisy views are arbitrarily mixed, it performs generation. We visualize the camera trajectory, where blue and red frustums denote clean input views and generated views, respectively. Table 5: Ablation study on geometry perception loss. We report results on RealEstate10K (Zhou et al. , 2018 ) under the 1-view setting. Figure 4: Visualization of comparisons with baselines. The large view on top denotes the input view, while the two smaller views below show novel views generated by each method. Table 6: Architecture of the two-stream DiT denoiser f θ f_{\theta} . Each block follows an MMDiT-style design: the clean and noise streams maintain independent pre-LayerNorm, QKV / output projections, SwiGLU MLP, and adaLN-Zero weights, while a single full attention is computed jointly over the concatenated [ Ω c ; Ω n ] [\,\Omega_{\mathrm{c}};\,\Omega_{\mathrm{n}}\,] tokens with shared q , k q,k -RMSNorm. The cross-attention to text and the timestep embedder are also shared across streams, and output heads are duplicated per stream so that both clean and noisy tokens are decoded into depth and 3D-Gaussian attributes at every patch. Table 7: Quantitative comparison on single-image 3D scene generation, per configuration. We evaluate on RealEstate10K (Zhou et al. , 2018 ) and DL3DV-10K (Ling et al. , 2024 ) under 1-view First Frame and 1-view Bidirectional. Best in bold ; second best underlined . Table 8: Quantitative comparison on two-view 3D scene generation, per configuration. We evaluate on RealEstate10K (Zhou et al. , 2018 ) and DL3DV-10K (Ling et al. , 2024 ) under 2-view Interpolation and 2-view Extrapolation. Best in bold ; second best underlined . Figure 5: Ablation study on the Geometry Perception loss in PixWorld. Given a single input image, our model generates the subsequent 7 frames (8 frames in total); we visualize 4 representative frames here for clarity. Pose accuracy is quantitatively evaluated by comparing the estimated camera poses against the ground-truth poses. Compared to the variant without Geometry Perception ( w/o Geom. ), the full model achieves more precise camera pose control and substantially mitigates the blurriness in later-view predictions, demonstrating that the global 3D perception loss is essential for maintaining both geometric consistency and visual fidelity over long generation horizons. Table 9: Inference speed comparison on a single NVIDIA A100-SXM4-80G GPU. We report the wall-clock time to generate one scene, the number of key frames per scene, and the number of function evaluations (NFE). Figure 6: More visualizations of reconstruction and generation under varying view selections, including camera trajectories with input and generated views marked, and the corresponding depth maps predicted by PixWorld. Figure 7: More visualizations of generated scenes. The first view is the input, and we show both RGB renderings and predicted depth maps.
This figure (Figure 3) visualizes the PixWorld model's performance under different settings, focusing on how it simultaneously handles 3D reconstruction and 3D generation tasks, as well as the relationships between camera trajectories, input views (clean/noisy), and generated views. We can break down the understanding into the following parts:
1. Structure and Component Meanings of the Figure
- Camera frustums on the left: Each frustum represents a camera’s viewpoint. The blue frustum (labeled “Clean view (input)”) denotes a clean input view (a known view used for reconstruction or as a basis for generation); the red frustum (labeled “Generated view (noise)”) denotes a generated view (output by the model when the input contains noise or new perspectives are needed). The position and direction of the frustums correspond to the camera’s position and orientation, illustrating the spatial distribution of the camera trajectory.
- Legend at the top: Clarifies color meanings: blue = clean input view, red = generated (noisy) view, gray = camera trajectory (though the trajectory is implicitly shown via frustum arrangement; gray may refer to lines connecting frustums, but color primarily distinguishes input from generation).
- Image grid: Each row represents a different scene or task setting, while each column corresponds to a timestep (or viewpoint sequence). For example:
- Top row: All frustums are blue (clean inputs), and the images show different perspectives of the same building. This demonstrates 3D reconstruction (reconstructing the same scene from multiple angles) when all inputs are clean views.
- Second row: The first frustum is blue (clean input), and subsequent ones are red (generated). The images show viewpoint changes in an indoor scene, illustrating 3D generation (generating new viewpoints from a known perspective) when inputs include one clean view and subsequent generated views.
- Other rows follow a similar pattern: some mix blue (input) and red (generated) frustums, showcasing the model’s ability to generate under “arbitrary mixing of clean and noisy views” (i.e., unified handling of reconstruction + generation).
2. How the Method Works (Operational Logic)
PixWorld’s core is a unified pixel-space diffusion paradigm combining 3D reconstruction and generation:
- Reconstruction mode: When all input views are “clean” (blue frustums), the model reconstructs the entire 3D scene from these inputs and renders images from different viewpoints (e.g., the top row, where all views are input-driven reconstructions, demonstrating multi-view consistency in the scene).
- Generation mode: When inputs include both “clean” and “noisy” views (blue + red frustums), the model generates new viewpoints (images corresponding to red frustums) based on known clean views. For example, in the second row, the first is an input (clean), and subsequent ones are generated viewpoints, showing how the model expands from a single viewpoint to a continuous sequence.
- Camera trajectory and viewpoint sequence: The camera trajectory is shown via frustum arrangement (changes in frustum positions in the same row), indicating the model generates continuous viewpoint sequences (e.g., timesteps or sequences of rotational/positional changes). For instance, in the third row’s outdoor scene, frustums move from left to right, and images show the scene rendered from different distances/angles, verifying the model’s consistent 3D space modeling.
3. Interpreting the Results (Conclusions)
From the figure, we can intuitively observe:
- Reconstruction consistency: When all inputs are clean views (e.g., the top row), the reconstructed (generated) views are highly consistent in scene content, lighting, and object positions, proving the model accurately reconstructs multi-view 3D scenes.
- Generation coherence: When inputs include both clean and generated views (e.g., the second, fourth, and fifth rows), the generated views (red) remain coherent with the input views (blue) in scene structure and object appearance, with no obvious breaks or mismatches. This shows the model generates geometrically consistent and visually realistic new viewpoints.
- Handling mixed inputs: Multiple rows mix blue (input) and red (generated) frustums, demonstrating the model’s flexibility in handling “arbitrary mixing of clean and noisy views”—that is, performing reconstruction (using clean inputs) and generation (supplementing new viewpoints) simultaneously. This reflects the method’s unified nature (no need to separate reconstruction and generation; instead, the same model and paradigm handle both).
In summary, this figure clearly demonstrates how PixWorld unifies 3D reconstruction and generation through visualized camera trajectories and mixed input/generated views: clean views serve as inputs (for reconstruction), while noisy/missing views are generated by the model, ultimately outputting continuous, consistent 3D scene viewpoint sequences. Each row corresponds to a task setting (pure reconstruction, pure generation, mixed inputs), columns correspond to temporal/spatial viewpoint sequences, and colors distinguish inputs from generations—intuitively verifying the model’s reconstruction consistency and generation coherence.