🌊 Tide

Information moves like the tide. We pick the waves worth studying.

中文

← Today's tide

Published 2026-06-29 · NUS, MMLab, CUHK, PKU · Xinlei Yu, Gen Li, Qingyi Si et al.

DOPD: Dual On-policy Distillation

arXiv · HuggingFace · ▲93

Abstract (verbatim)

On-policy distillation (OPD) offers superior capacity transfer by supervising student-sampled trajectories with dense token-level signals. To furnish high-quality supervision sources and thereby elevate the performance frontier of distillation, an intuitive direction is to infuse privileged information to either teacher or student itself. However, this additional input induces a potential failure mode we dub privilege illusion: a pattern that conflates the transferable capability gap that students are meant to close, and the information asymmetry gap that can only be mimicked but never replicated. This issue is further amplified by the inherent non-uniformity of token-level supervision, where only a small subset of tokens carries pivotal capability-bearing signals. To this end, we propose DOPD, an advantage-aware dual distillation paradigm that dynamically routes token-level supervision between privileged teacher and privileged student policies based on their advantage gap and relative probabilities. Each token receives supervision of different strength, objective, and strategy from either teacher or student itself, which transfers credible capability while simultaneously receiving auxiliary signals, to alleviate privilege illusion. Extensive experiments on both large language model (LLM) and vision-language model (VLM) settings demonstrate that DOPD consistently outperforms Vanilla OPD and other counterparts. Further results on stability, robustness, continual learning, and out-of-distribution tasks validate its superiority.

Background

To understand this research, we first clarify the technical background: Model distillation, a core technique for transferring capabilities from a "teacher" to a "student" model, is widely used in optimizing large language models (LLMs) and vision-language models (VLMs). Traditional methods rely on "off-policy trajectories," but student models' behavior distributions may diverge from teachers. The emerging "on-policy distillation" (OPD) addresses this by having student models generate their own trajectories and using teachers' token-level supervision, improving efficiency and performance. However, OPD's upper performance limit is constrained by supervision quality—when "privileged information" (e.g., reasoning hints for LLMs or structured annotations for VLMs) is introduced, it may create "privilege illusion": the student mimics surface advantages from information asymmetry rather than truly transferable abilities.

Previous limitations stem from uniform supervision strategies. Existing OPD methods treat all tokens equally, ignoring their value differences. For example, some tokens carry critical capability signals (e.g., logical reasoning steps), while others are noisy. When privileged information is added, this uniform supervision causes students to overfit "privilege shortcuts" instead of core abilities, leading to performance instability, reduced exploration, and training collapse.

This paper's solution is "Dual On-policy Distillation" (DOPD). Its core idea is to dynamically differentiate token supervision sources: For tokens where the teacher has a credible capability advantage, stronger teacher supervision is used to transfer high-value signals; for tokens dominated by privileged information or irrelevant to core abilities, lighter supervision (or student self-supervision) is applied to avoid overfitting. DOPD adjusts supervision strength, objectives, and strategies for each token based on "advantage gaps" (between teacher and student) and "predicted probabilities," reducing privilege illusion.

Key differences from prior work: Unlike Vanilla OPD, DOPD does not assume all tokens contribute equally to capability transfer. It selectively allocates supervision resources, combining teacher supervision (for transferable privileges) and student self-supervision (for stability/exploration) via dynamic routing. This not only improves performance (significantly outperforming Vanilla OPD on LLM/VLM tasks) but also enhances robustness, continual learning, and out-of-distribution generalization. Its innovation lies in shifting privileged information use from "blind imitation" to "selective absorption," addressing OPD's core flaws.
Method, Figure by Figure

M E T H O D1 / 5

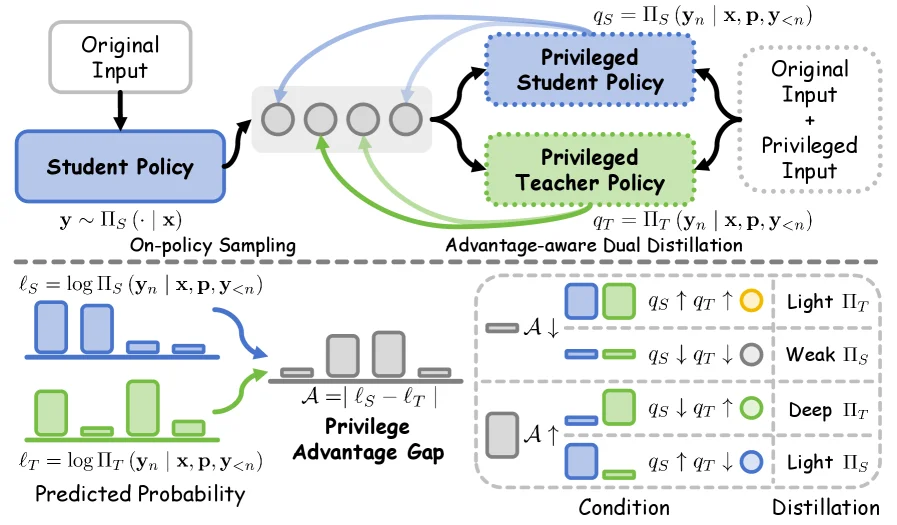
Figure 5 : Overview of our proposed DOPD.

This diagram illustrates the overall architecture of the DOPD (Dual On-policy Distillation) method, which we can break down into several key components for better understanding:

Input and Policy Sampling Phase

  • Original Input: First, the original input is fed into the Student Policy module. The student policy generates an output sequence \( y \sim \Pi_S(\cdot | x) \), where \( \Pi_S \) represents the probability distribution of the student policy. This process is On-policy Sampling, meaning the sampling is based on the current student policy itself.

Privileged Policy and Distillation Phase (Advantage-aware Dual Distillation)

  • Privileged Student Policy and Privileged Teacher Policy: These two policies take "Original Input + Privileged Input" as their input. They each compute their conditional probabilities \( q_S = \Pi_S(y_n | x, p, y_{<n}) \) and \( q_T = \Pi_T(y_n | x, p, y_{<n}) \), where \( y_n \) is the nth token, \( x \) is the input, \( p \) might be privileged information, and \( y_{<n} \) is the sequence of previous tokens.
  • Information Flow: The output \( y \) from the student policy is fed back into the privileged student policy and the internal loop of the student policy (the gray circle in the diagram, possibly indicating policy updates or state maintenance). Meanwhile, there is information interaction between the privileged student policy and the privileged teacher policy (black arrows), and the output of the student policy also flows to these two privileged policies (blue and green arrows). The core of this phase is Advantage-aware Dual Distillation, which means simultaneously using the privileged policies of the student and teacher for distillation, while considering their "advantages".

Privilege Advantage Gap & Predicted Probability

  • Predicted Probability: The two histograms at the bottom of the diagram represent the predicted probabilities of the student policy (blue) and the teacher policy (green), \( \ell_S = \log \Pi_S(y_n | x, p, y_{<n}) \) and \( \ell_T = \log \Pi_T(y_n | x, p, y_{<n}) \). The log probabilities here can be understood as the prediction confidence for each token.
  • Privilege Advantage Gap: The advantage gap is calculated as \( \mathcal{A} = |\ell_S - \ell_T| \), which is the absolute value of the difference between the log probabilities of the student's and teacher's predicted probabilities. This gap \( \mathcal{A} \) is used to dynamically determine the distillation method.

Condition & Distillation

  • Condition Classification: Based on the changes in \( \mathcal{A} \) (increasing or decreasing) and the changes in \( q_S \) and \( q_T \) (increasing or decreasing), the situations are divided into four categories:
    • When \( \mathcal{A} \) decreases, and both \( q_S \) and \( q_T \) increase (marked as "Light \( \Pi_T \)"), the corresponding distillation strategy (yellow circle) is adopted.
    • When \( \mathcal{A} \) decreases, and both \( q_S \) and \( q_T \) decrease (marked as "Weak \( \Pi_S \)"), the strategy of the gray circle is adopted.
    • When \( \mathcal{A} \) increases, and \( q_S \) decreases while \( q_T \) increases (marked as "Deep \( \Pi_T \)"), the strategy of the green circle is adopted.
    • When \( \mathcal{A} \) increases, and \( q_S \) increases while \( q_T \) decreases (marked as "Light \( \Pi_S \)"), the strategy of the blue circle is adopted.
  • Dynamic Routing Distillation: Each token receives supervision of different intensities, targets, and strategies based on its advantage gap with the teacher and student policies and its relative probability. The purpose of this is to transfer reliable capabilities while receiving auxiliary signals to mitigate the "privilege illusion" problem, that is, to avoid confusing the transferable capability gap that the student needs to narrow and the information asymmetry gap that can only be imitated but not replicated.

Summary of the Method's Operation Process

  1. The original input enters the student policy, and the student policy generates an output sequence under on-policy sampling.
  2. This output sequence is fed back to the internal part of the student policy and sent to the privileged student policy and the privileged teacher policy as input (plus privileged input).
  3. The privileged student policy and the privileged teacher policy each compute their conditional probabilities, and based on these probabilities, they calculate the predicted probabilities and the advantage gap.
  4. According to the changes in the advantage gap and the probabilities, the token is classified into different distillation conditions, and then the corresponding distillation strategy is adopted. It dynamically obtains supervision signals from the privileged teacher or the privileged student policy (or itself) to achieve capability transfer and mitigate the privilege illusion problem.

In this way, DOPD can apply supervision of different intensities and strategies to different tokens, thus performing distillation more effectively and improving model performance.

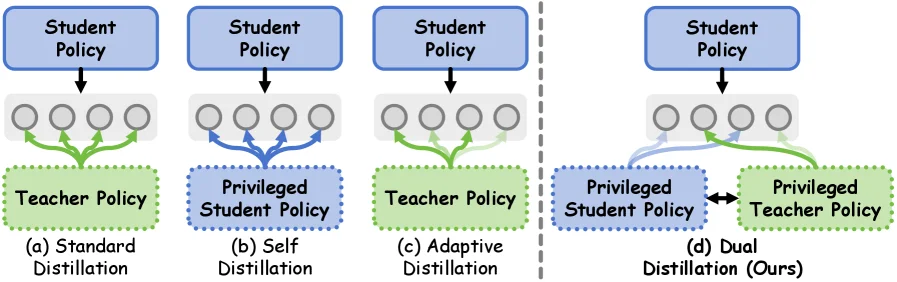
Figure 2 : Comparison of existing (a) standard distillation, (b) self distillation, and (c) adaptive distillation paradigms with our proposed (d) dual distillation paradigm.

This figure (Figure 2) clearly compares several existing knowledge distillation paradigms with our proposed Dual On-policy Distillation (DOPD) paradigm. Let's analyze each subplot:

(a) Standard Distillation: This subplot illustrates the most basic distillation paradigm. The "Student Policy" module at the top represents the student model that is learning. Four circles below the Student Policy, with an arrow pointing downwards from the Student Policy, typically represent a sequence of outputs or states generated by the student model (e.g., actions or observations in reinforcement learning, or token sequences in language models). Then, green arrows originate from these four circles, pointing towards the "Teacher Policy" module below. This indicates that in standard distillation, the supervision signal primarily comes from the teacher policy, and the student policy's outputs are compared with the teacher policy's outputs for learning to mimic the teacher's behavior. The information flow is mainly from the student to the teacher, or the student tries to match the teacher's output.

(b) Self Distillation: This subplot shows the self-distillation paradigm. The "Student Policy" module is still present, but the four circles below it now receive blue arrows from a module named "Privileged Student Policy." This means that in self-distillation, a part of the student model (the privileged student policy) acts as a supervisor, providing supervision signals to another part of the student model. The term "privileged" might imply that this part has more information or stronger capabilities. The information flow is mainly from the privileged student policy to the regular student policy, with knowledge transfer and learning occurring internally within the student model.

(c) Adaptive Distillation: This subplot combines the features of the previous two paradigms. The four circles representing the output of the "Student Policy" module now receive both green arrows from the "Teacher Policy" and light-green arrows from the "Privileged Student Policy." This indicates that in adaptive distillation, the supervision signal source for the student policy is dynamic, possibly selecting or weighting between the teacher policy and the privileged student policy based on some criterion. The green arrows likely represent the primary supervision signal, while the light-green arrows might represent auxiliary or supplementary signals. The information flow is mixed, coming from both the teacher and the privileged student policy.

(d) Dual Distillation (Ours): This subplot illustrates our proposed DOPD paradigm, which is the core of the figure. The four circles representing the output of the "Student Policy" module at the top now interact with two modules: the "Privileged Student Policy" on the left and the "Privileged Teacher Policy" on the right. The key difference lies in the bidirectionality and color of the arrows. * Blue arrows go from the "Student Policy" outputs to the "Privileged Student Policy," indicating that the student policy provides information to or receives supervision from the privileged student policy. * Green arrows go from the "Privileged Teacher Policy" to the "Student Policy" outputs, indicating that the privileged teacher policy provides supervision signals to the student policy. * Most importantly, there is a bidirectional arrow (or interactive connection) from the "Privileged Student Policy" to the "Privileged Teacher Policy," which suggests that information exchange or mutual influence occurs between these two "privileged" modules. This design allows the model to dynamically route supervision signals based on their "advantage gap" and "relative probabilities." The core idea of this method is that different tokens (or states) might require different types or strengths of supervision. By dynamically assigning supervision tasks to either the privileged student policy or the privileged teacher policy, DOPD aims to transfer credible capabilities more effectively while avoiding the "privilege illusion" problem—the issue where a student tries to mimic privileged information that is unique to the teacher but cannot be truly learned.

In summary, this figure reveals how the DOPD method operates: 1. Multi-source Supervision: Supervision signals for the student policy can come from the teacher policy, the privileged student policy, or a combination of both. 2. Dynamic Routing: The source of the supervision signal is not fixed but is dynamically selected based on some criteria (e.g., advantage gap and relative probabilities). 3. Privileged Module Interaction: In DOPD, there is interaction between the privileged student policy and the privileged teacher policy, making the supervision strategy more flexible and adaptive. 4. Differentiated Handling: Each token (or state) can receive supervision of different strength, objective, and strategy, thus learning the required capabilities more effectively.

Through this design, DOPD aims to address potential privilege illusion issues in existing methods and improve distillation performance.

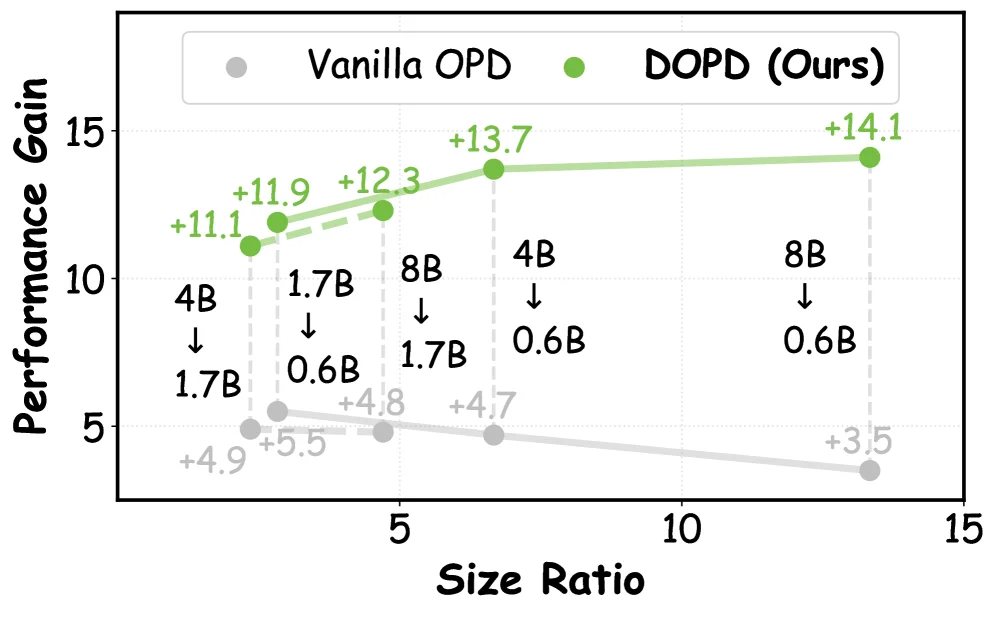
(a) Performance Gain vs. Teacher-student Size Ratio (b) Gap Reduction vs. Teacher-student Size Ratio Figure 6 : Scalability comparison of proposed DOPD and Vanilla OPD on (a) performance gain and (b) teacher-student gap reduction ratio. Here, the solid and dashed lines represent the 0.6B and 1.7B student policy, respectively.

This figure (Figure 6a) illustrates a performance comparison between the proposed DOPD method and the Vanilla OPD method across different "teacher-student model size ratios."

First, let's understand the components of the graph: - X-axis (Horizontal Axis): Labeled "Size Ratio," this represents the proportion between the teacher model and the student model sizes. From left to right, the ratio increases, with key points including a 4B teacher vs. 1.7B student (ratio ~2.35), 1.7B teacher vs. 0.6B student (ratio ~2.83), 8B teacher vs. 1.7B student (ratio ~4.71), 4B teacher vs. 0.6B student (ratio ~6.67), and 8B teacher vs. 0.6B student (ratio ~13.33). These values are indicated by arrows and labels such as "4B ↓ 1.7B" and "8B ↓ 0.6B." - Y-axis (Vertical Axis): Labeled "Performance Gain," this indicates the improvement in model performance through the distillation process. Values increase from bottom to top, ranging approximately from 0 to over 15. - Data Series: There are two main data series represented by different colors and markers: - Gray dots and dashed lines represent "Vanilla OPD" (the original On-policy Distillation method). - Green dots and solid lines represent "DOPD (Ours)" (the method proposed in the paper). - Data Points and Annotations: Each data point has a numerical annotation indicating the performance gain at that specific "Size Ratio." For example, at "4B ↓ 1.7B," Vanilla OPD shows a performance gain of about +4.9, while DOPD shows a gain of about +11.1. As the "Size Ratio" increases, we can observe the performance of different methods under various teacher-student size combinations.

Next, let's analyze the operational method and results revealed by this graph: - Operational Method: DOPD is an "advantage-aware dual distillation paradigm" that dynamically allocates "token-level supervision" between "privileged teacher policies" and "privileged student policies" based on the "advantage gap" and "relative probability" between the teacher and student strategies. This means that for each token, it receives supervision of varying intensity, targets, and strategies from either the teacher or the student itself, thereby receiving auxiliary signals while transferring credible capabilities to mitigate the so-called "privileged illusion" problem (i.e., confusing the transferable capability gap that students need to compensate with the information asymmetry gap that can only be imitated but not replicated). - Result Analysis: - Performance Gain Comparison: It is evident from the graph that DOPD significantly outperforms Vanilla OPD across all displayed "Size Ratios." For instance, at "4B ↓ 1.7B," DOPD's performance gain (+11.1) is much higher than that of Vanilla OPD (+4.9); at "8B ↓ 0.6B," DOPD's performance gain (+14.1) is also much higher than that of Vanilla OPD (+3.5). - Trend Analysis: As the "Size Ratio" increases, DOPD's performance gain shows an upward trend (from +11.1 to +14.1), while Vanilla OPD's performance gain shows a downward trend (from +4.9 to +3.5). This indicates that DOPD can better leverage the distillation process to enhance performance when dealing with different sizes of teacher and student models, especially when the teacher model is larger and the student model is smaller, DOPD's advantage is more pronounced. - Comparison Objects: The comparison objects in the graph are the two methods, Vanilla OPD and DOPD. By comparing their performance gains at different "Size Ratios," we can clearly see DOPD's advantage in performance improvement.

In summary, this figure, by showing the "performance gain" at different "teacher-student model size ratios," clearly demonstrates that the proposed DOPD method significantly outperforms the Vanilla OPD method in terms of performance improvement. DOPD effectively mitigates the privileged illusion problem through dynamic allocation of token-level supervision, thereby achieving higher performance gains across different combinations of teacher and student model sizes.

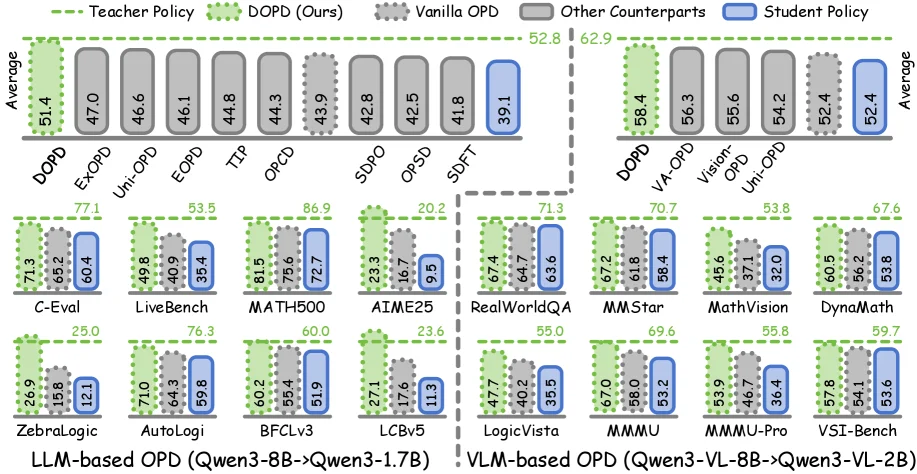
Figure 1 : Performance comparison of our DOPD with competing approaches across eight benchmarks in terms of average across all benchmarks (upper bigger bars) and individual values of each benchmark (lower small bars).

This figure is from the paper "DOPD: Dual On-policy Distillation" and illustrates a performance comparison between the authors' proposed DOPD method and existing competing methods across various benchmark tests. We can understand this figure from the following aspects:

First, the overall structure of the figure is divided into two parts. The upper part is "Average Performance," which shows the average scores of each method across all benchmarks, represented by larger green bars. The lower part displays "Individual Values of Each Benchmark," represented by smaller bars, and these benchmarks are categorized into two main types: LLM-based OPD and VLM-based OPD.

Axes and Data Labels: - The vertical axis (Y-axis) lists the names of different methods (such as DOPD, EX-OPD, Uni-OPD, etc.) and specific benchmark names (such as C-Eval, LiveBench, MATH500, etc.). - The horizontal axis (X-axis) represents the performance score, with numerical labels at the end or above each bar. - Bars of different colors represent different entities: * Green dashed bars: Represent the performance of the "Teacher Policy." * Light green solid bars: Represent the performance of the authors' proposed "DOPD (Ours)" method. * Gray dotted bars: Represent the performance of "Vanilla OPD" (i.e., standard on-policy distillation). * Gray solid bars: Represent the performance of "Other Counterparts." * Blue solid bars: Represent the performance of the "Student Policy."

Information Flow and Interpretation: 1. Upper Part - Average Performance: * The left side shows the average performance of each method in the LLM-based OPD scenario. DOPD (light green) has an average score of 52.8, which is higher than Vanilla OPD (gray dotted, 41.8) and other counterparts (gray solid, 39.1), and is close to the Teacher Policy (green dashed, 51.4) and significantly higher than the Student Policy (blue, 39.1). * The right side shows the average performance of each method in the VLM-based OPD scenario. DOPD (light green) has an average score of 67.6, which is also higher than Vanilla OPD (gray dotted, 55.6), other counterparts (gray solid, 52.4), and the Student Policy (blue, 52.4), and is better than the Teacher Policy (green dashed, 58.4).

  1. Lower Part - Individual Benchmarks:
    • This part details the performance of different methods on specific benchmarks. Each benchmark has a set of bars corresponding to the Teacher Policy, DOPD, Vanilla OPD, other counterparts, and the Student Policy.
    • For example, in the "C-Eval" benchmark (LLM-based):
      • The Teacher Policy scores 77.1.
      • DOPD scores 65.2.
      • Vanilla OPD scores 62.5.
      • Other counterparts score 60.4.
      • The Student Policy scores 60.4.
      • It can be seen that DOPD performs well across multiple benchmarks.
    • In the "MATH500" benchmark (LLM-based):
      • The Teacher Policy scores 86.9.
      • DOPD scores 75.6.
      • Vanilla OPD scores 72.7.
      • Other counterparts score 35.4.
      • The Student Policy scores 35.4.
    • In the "LogicVista" benchmark (VLM-based):
      • The Teacher Policy scores 55.0.
      • DOPD scores 47.7.
      • Vanilla OPD scores 40.2.
      • Other counterparts score 35.5.
      • The Student Policy scores 35.5.

Revealing How the Method Works: Although this figure mainly presents results, combined with the paper's abstract, we can understand how the DOPD method works: * Objective: DOPD aims to address the "privilege hallucination" problem, where the student model tries to imitate additional information (privileged information) that the teacher model possesses, and this information cannot be fully replicated by the student. * Method: DOPD is an "advantage-aware dual distillation paradigm." It dynamically allocates token-level supervision signals between the privileged teacher policy and the privileged student policy based on the "advantage gap" between the teacher policy and the student policy and their "relative probabilities." * Effect: This means that each token will receive supervision signals of different intensities, targets, and strategies from either the teacher or the student itself. This approach can transfer reliable capabilities while receiving auxiliary signals, thereby alleviating privilege hallucination. As can be seen from the figure, DOPD outperforms Vanilla OPD and other counterparts in most benchmarks, indicating that its strategy of dynamically routing supervision signals is effective.

Conclusion: This figure clearly shows that the DOPD method has superior performance compared to Vanilla OPD and other counterparts in the online policy distillation tasks of LLMs and VLMs. Whether in terms of average performance or on individual benchmarks, DOPD performs excellently, validating the effectiveness of the dual distillation paradigm proposed in the paper. Specific experimental setup details (such as dataset splitting, training epochs, etc.) are not visible in the figure, but these results are sufficient to demonstrate the advantages of DOPD.

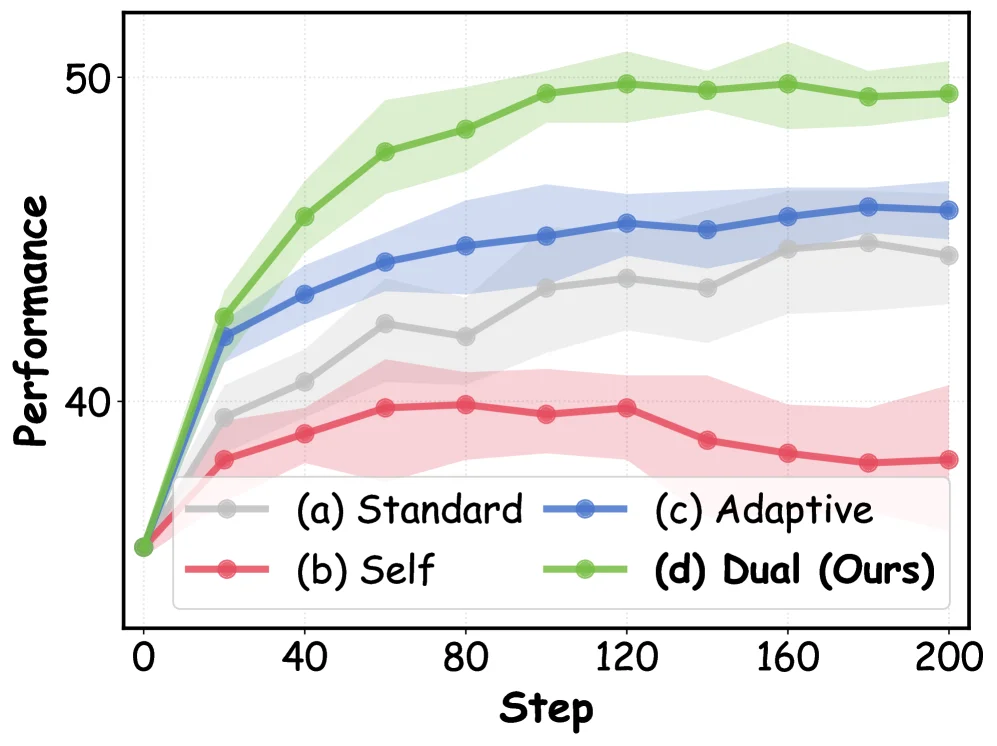
(a) Performance vs. Training Step (b) Entropy vs. Training Step Figure 8 : Training stability comparison of proposed DOPD and representative baselines, reporting the (a) performance and (b) entropy trends over training steps on LiveBench.

This figure (Figure 8a) illustrates the performance trends of different methods during the training process as a function of training steps (Step), aiming to compare the training stability of the proposed Dual On-policy Distillation (DOPD, i.e., (d) Dual (Ours) in the figure) with several representative baseline methods. Let's first examine the structure of the figure:

  • X-axis (Horizontal Axis): Represents the training steps (Step), ranging from 0 to 200, indicating the progress of training.
  • Y-axis (Vertical Axis): Represents performance, with values approximately ranging from 35 to 50; higher values indicate better model performance.
  • Curves and Shading: Each curve represents a method. The points on the curve denote the mean performance of the method at the corresponding training step, while the shaded area around the curve (e.g., green, blue, gray, red shading) typically represents the standard deviation or confidence interval of the performance, showing the fluctuation in performance. A narrower shading indicates more stable training.
  • Legend: There are four curves in the figure, corresponding to four methods:
  • (a) Standard: Gray curve, representing the standard training method.
  • (b) Self: Red curve, representing the self-supervised or self-training method.
  • (c) Adaptive: Blue curve, representing the adaptive training method.
  • (d) Dual (Ours): Green curve, representing the proposed DOPD method.

Next, we analyze the performance trends of each method:

  1. Initial Stage (Step ≈ 0): The performance of all methods is low and relatively similar, indicating that the initial performance of the models is similar when training just starts.
  2. Rapid Improvement Stage (Step ≈ 0 to 40): The performance of all methods improves significantly. Among them, the green curve (DOPD) has the fastest improvement speed and quickly surpasses the other methods. The blue curve (Adaptive) follows, while the gray curve (Standard) and the red curve (Self) have relatively slow improvement.
  3. Stable Stage (Step ≈ 40 to 200):
  4. The green curve (DOPD), after reaching a high performance, remains relatively stable with small fluctuations (narrow shading), indicating that the training process is stable and the performance does not easily decrease after improvement.
  5. The blue curve (Adaptive), after improving to a certain extent, becomes stable, with slightly larger fluctuations than DOPD.
  6. The performance of the gray curve (Standard) fluctuates after improvement, especially between Step ≈ 120 and 160, where there is a small rise followed by a slight decline.
  7. The performance of the red curve (Self), after improving to about 40, gradually decreases, indicating that the performance of this method degrades in the later stage of training and has poor training stability.

Then, let's look at the working mechanism of the method revealed by this figure (combined with the paper abstract):

The proposed DOPD is an advantage-aware dual distillation paradigm that dynamically allocates token-level supervision between the privileged teacher and the student itself based on the advantage gap and relative probability between the teacher policy and the student policy. Each token receives supervision of different intensities, targets, and strategies from the teacher or the student itself, thus both transmitting credible capabilities and receiving auxiliary signals, thereby alleviating the "privileged illusion" problem.

From the figure, it can be seen that DOPD (green curve) performs the best and has the best stability during the training process. This shows that DOPD effectively improves the model performance through dynamic routing of token-level supervision and maintains stable performance during the training process, verifying that the method proposed in the paper can alleviate the privileged illusion and improve training stability and performance.

Finally, comparison objects and conclusions:

  • Comparison objects: Standard (standard training), Adaptive (adaptive training), Self (self-training), and Dual (Ours) (DOPD).
  • Conclusion: The performance of DOPD is always higher than that of the other three methods during the training process (from Step = 0 to Step = 200), and it has better training stability (narrower shading). This indicates that the proposed DOPD method has better training stability and performance than the existing baseline methods on the LiveBench benchmark, verifying its effectiveness.

In summary, this figure, by showing the performance changes of different methods during training steps, clearly demonstrates the advantages of DOPD in terms of training stability and performance improvement, supporting the conclusion that the method proposed in the paper can effectively alleviate the privileged illusion and improve the model's performance.

← → flip · ↑ ↓ scroll notes · Esc exit