🌊 Tide

Information moves like the tide. We pick the waves worth studying.

中文

← Today's tide

Published 2026-06-26 · AI at Meta · Shoufa Chen, Luyuan Wang, Xuan Yang et al.

TUA-Bench: A Benchmark for General-Purpose Terminal-Use Agents

arXiv · HuggingFace · ▲47

Abstract (verbatim)

As large language models and harness frameworks continue to advance, agents operating in terminals are increasingly capable of performing a broader range of general computer-use tasks beyond coding. However, existing benchmarks do not adequately evaluate general-purpose terminal computer-use agents (TUAs): general computer-use benchmarks primarily target graphical user interfaces (GUIs), whereas terminal-based benchmarks largely emphasize technical and programming-centric workflows historically native to the shell. We introduce TUA-Bench, a general-purpose benchmark for terminal-use agents. TUA-Bench includes 120 real-world tasks across five task families, covering routine digital activities-including document editing, email management, and live-web information seeking-as well as scientific and engineering workflows co-designed with PhD-level domain experts that require specialized software. This breadth distinguishes TUA-Bench from prior shell-focused or domain-specific benchmarks. Each task is manually designed, runs in a real terminal with a deterministic setup script, and is evaluated by an execution-based scoring protocol. We find that the strongest frontier agent, Claude Code with Claude Opus 4.8 max reasoning effort, achieves 65.8% overall performance, with substantial gaps across both tracks. By providing a broad and realistic evaluation of terminal-use capabilities, TUA-Bench aims to accelerate the transition from narrow, task-specific assistants to general-purpose agents capable of operating reliably across diverse digital environments.

Background

Background Analysis

1. Technical Context

With the advancement of large language models (LLMs), terminal-use agents have evolved from simple programming assistants to general-purpose tools capable of executing complex, multi-step tasks. These technologies are applied in scenarios requiring efficient computer operation, such as document editing, email management, web information retrieval, and scientific or engineering workflows. Command-line interfaces (CLIs) are naturally suited for LLMs because commands are explicit, feedback is structured, and complex processes can be composed through scripts. However, existing terminal benchmarks primarily focus on technical or programming tasks, failing to evaluate agents’ performance in broader daily and professional contexts.

2. Previous Limitations

Early terminal benchmarks (e.g., Terminal-Bench) were limited to shell-native workflows, neglecting general-purpose use cases. For example, ordinary users might need to edit documents or query web information via terminals, while researchers rely on them for specialized software. These tasks require not only technical skills but also long-horizon planning, tool coordination, and error recovery—capabilities poorly measured by existing tests. Additionally, GUI-based benchmarks, while human-friendly, introduce visual perception challenges that distract from assessing core language model abilities.

3. Proposed Solution

TUA-Bench addresses this gap by designing 120 real-world tasks (covering both daily and professional scenarios). Tasks are co-created with domain experts (e.g., PhDs in biology and engineering) to ensure realism and rigor. Each task runs in a controlled environment with automated verification, and the evaluation protocol focuses on execution-based outcomes rather than subjective judgments. The study tests state-of-the-art models (e.g., Claude Code) and finds even the best agents achieve only 65.8% success, highlighting gaps in planning, tool use, and error handling.

4. Key Differences

Compared to prior work, TUA-Bench stands out for its generality and realism. It expands beyond traditional terminal tasks to include non-technical scenarios (e.g., document editing) and incorporates professional workflows designed with domain experts. Tasks are carefully curated to eliminate ambiguity or triviality, ensuring meaningful evaluation. This makes TUA-Bench a reliable benchmark for advancing general-purpose terminal agents capable of operating across diverse digital environments.
Method, Figure by Figure

M E T H O D1 / 5

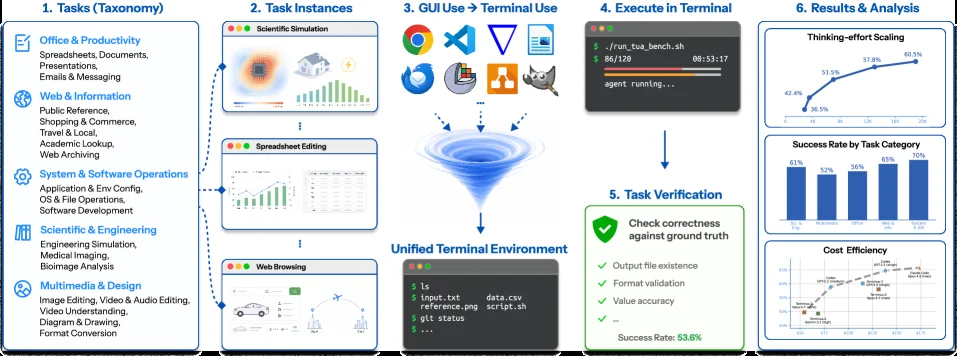
Figure 1: Overview of TUA-Bench. TUA-Bench evaluates terminal-use agents on realistic, application-grounded tasks spanning a five-domain taxonomy of real-world workflows. Each workflow is instantiated as concrete tasks in a unified terminal environment. Tasks that would conventionally require graphical interfaces are reformulated as GUI-to-terminal problems, requiring agents to interact solely through the command line. Agents execute each task autonomously, and the resulting rollout is automatically verified against ground truth.

This diagram provides an overview of TUA-Bench, illustrating the evaluation process for terminal-use agents on real-world, application-based tasks spanning five domain categories of practical workflows. Here's a detailed breakdown of each section:

1. Tasks (Taxonomy)

This section categorizes tasks into five domains:
- Productivity & Office: Spreadsheets, documents, presentations, email/messaging.
- Web & Information: Public references, shopping/commerce, travel/local, academic research, web archiving.
- System & Software Operations: Application/environment configuration, OS/file operations, software development.
- Science & Engineering: Scientific/engineering tasks, mathematics, bioinformatics analysis.
- Multimedia & Design: Image/video/audio editing, video understanding, charting, format conversion.
This defines the scope of tasks TUA-Bench evaluates, covering both daily digital activities and professional workflows.

2. Task Instances

Three concrete task examples are shown: scientific simulation, spreadsheet editing, and web browsing. These instances are derived from the five domains above but rephrased as "GUI-to-terminal" problems—tasks originally requiring a graphical interface are now framed as command-line interactions for the agent to solve.

3. GUI Use → Terminal Use

A funnel graphic represents converting GUI-dependent tasks into terminal-compatible workflows. GUI-related icons (e.g., browser, email, file manager) feed into the funnel, which outputs to a "Unified Terminal Environment." This step redesigns GUI tasks into executable terminal commands, enabling agents to handle them via command-line interactions.

4. Execute in Terminal

A terminal interface shows command execution (e.g., running ./tua_bench.sh, displaying agent running... with timestamps) and command-line examples (ls, input.txt, data.csv, reference_script.sh, git status). This demonstrates the agent autonomously executing tasks in the terminal by inputting commands to complete the instances.

5. Task Verification

Verification criteria include checking correctness (vs. ground truth), output file existence, format validation, and value accuracy. A success rate of 53.6% is provided, representing automated validation of task outcomes to determine if the agent’s work meets requirements.

6. Results & Analysis

Three charts are shown:
- Thinking-effort Scaling: A curve showing how cognitive effort (y-axis, ~36.5–43.5%) varies with a task attribute (x-axis, e.g., complexity).
- Success Rate by Task Category: A bar graph comparing success rates (~57–67%) across different task categories (x-axis).
- Cost Efficiency: A line graph illustrating efficiency trends relative to cost variables (e.g., time/resources, x-axis).

Workflow & Methodology

The process flows as: (1) Task categorization → (2) Instance creation → (3) GUI-to-terminal conversion → (4) Terminal execution → (5) Result verification → (6) Analysis. TUA-Bench evaluates terminal-use agents by:
- Defining a multi-domain taxonomy of 120 real-world tasks from daily and professional workflows.
- Re framing GUI-dependent tasks as terminal commands for agents to execute in a unified environment.
- Automatically validating results (correctness, output, format, values) to score performance.

Key Insights from Results

  • Thinking-effort Scaling: Shows how cognitive demand varies across tasks.
  • Success Rate by Task Category: Highlights performance differences across task types, indicating strengths/weaknesses.
  • Cost Efficiency: Analyzes trade-offs between resource input (e.g., time) and output efficiency.

TUA-Bench aims to provide a broad, realistic assessment of terminal-use capabilities to accelerate the shift from narrow task-specific assistants to general-purpose terminal agents.

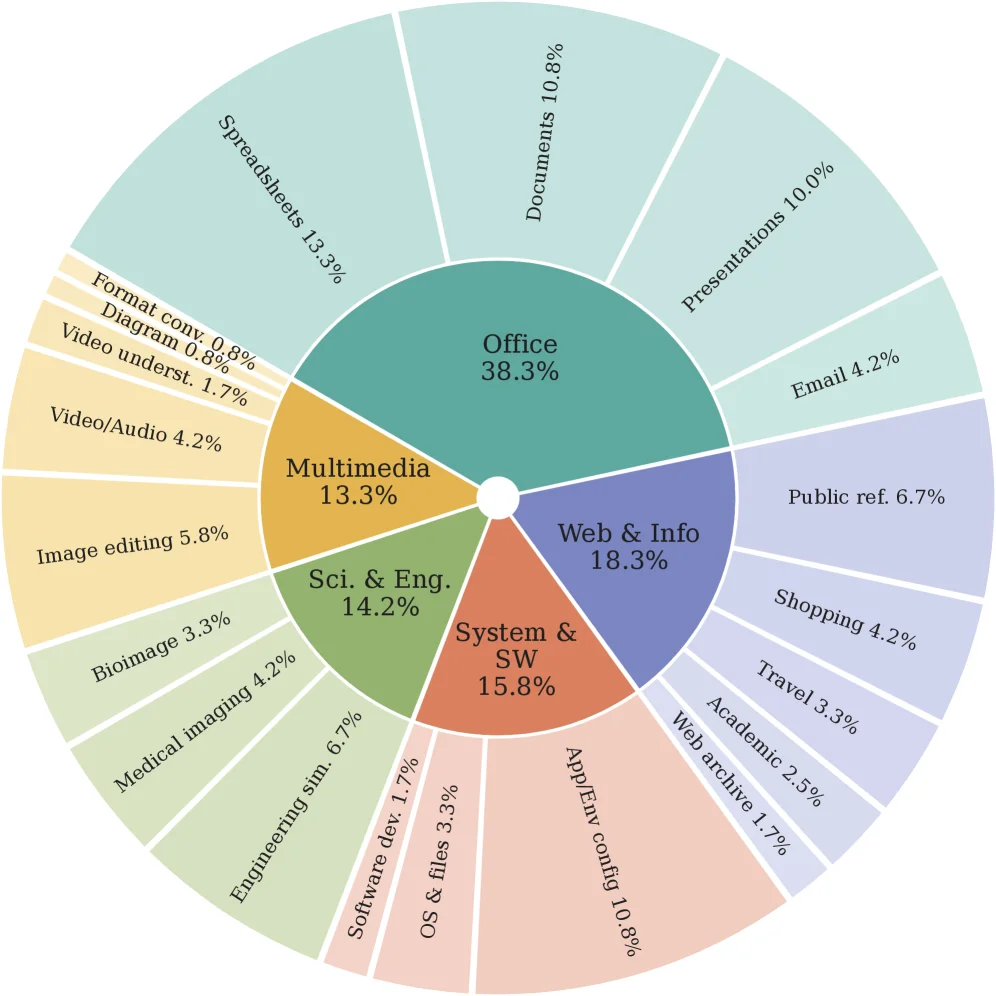
Figure 2: TUA-Bench task distribution. The 120 tasks span five categories with fine-grained subcategories, covering both everyday digital work and expert professional workflows.

This figure (Figure 2) clearly illustrates the distribution of the 120 tasks within the TUA-Bench benchmark. These tasks are organized in a multi-level pie chart, expanding from the center outwards, representing five main categories and their fine-grained subcategories, covering both everyday digital work and expert professional workflows.

First, we observe the innermost pie chart, which divides all tasks into five major categories: 1. Office: Occupies the largest share at 38.3%. This indicates that TUA-Bench places significant emphasis on tasks related to daily office work. 2. Web & Info: Accounts for 18.3%, covering internet-related activities. 3. System & SW: Represents 15.8%, involving system administration and software operation tasks. 4. Sci. & Eng.: Constitutes 14.2%, including scientific computing and engineering-related professional tasks. 5. Multimedia: Makes up 13.3%, involving the processing and editing of multimedia content.

Next, each main category is further subdivided into more specific subcategories, which are displayed in the outer layers of the pie chart and labeled with their respective percentages: * The Office category is divided into: * Spreadsheets: 13.3% * Documents: 10.8% * Presentations: 10.0% * Email: 4.2% These subcategories represent typical office software application scenarios.

  • The Web & Info category is divided into:

    • Public ref. (Public reference): 6.7%
    • Shopping: 4.2%
    • Travel: 3.3%
    • Academic: 2.5%
    • Web archive: 1.7% These subcategories reflect common web browsing and information retrieval activities.
  • The System & SW category is divided into:

    • AppEnv config (Application Environment Configuration): 10.8%
    • OS & files (Operating System & Files): 3.3%
    • Software dev. (Software Development): 6.7%
    • Engineering sim. (Engineering Simulation): 6.7%
    • Medical imaging: 4.2%
    • Bioimage: 3.3% These subcategories involve system management, software development, and the use of specialized software in specific domains.
  • The Sci. & Eng. category is divided into:

    • Video/Audio: 4.2%
    • Image editing: 5.8% These subcategories represent common media processing tasks in scientific and engineering fields.
  • The Multimedia category is divided into:

    • Video underst. (Video Understanding): 1.7%
    • Diagram: 0.8%
    • Format conv. (Format Conversion): 0.8% These subcategories involve the analysis and conversion of multimedia.

This figure reveals how TUA-Bench is designed and organized through this hierarchical structure. It does not simply collect a random set of tasks but systematically categorizes them into different domains and sub-domains to comprehensively evaluate the capabilities of Terminal-Use Agents (TUAs) across various common and professional workflows. The percentage of each task indicates its relative weight or quantity within the entire benchmark. In this way, readers can intuitively understand the task coverage of TUA-Bench and the balance between everyday digital work and professional workflows. For example, office tasks account for nearly one-fifth of the total, while scientific and engineering tasks also hold a significant proportion, indicating that the benchmark aims to assess the generality of agents in a wide range of scenarios.

In summary, this figure shows how the 120 tasks in TUA-Bench are distributed across five main categories (Office, Web & Info, System & SW, Sci. & Eng., Multimedia) and their subdivided subcategories. Each category and subcategory has a clear label and corresponding percentage, which helps in understanding the task composition and focus areas of the benchmark. This approach ensures a comprehensive evaluation of terminal-use agents, including not only basic daily tasks but also expert-level tasks requiring specialized knowledge and specific software.

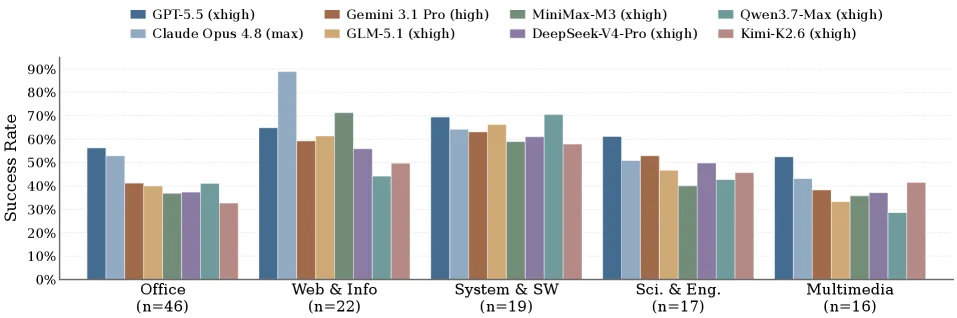
Figure 6 : Per-category success rates on TUA-Bench for eight models , each run with the Terminus-2 agent under the indicated reasoning-effort setting (in parentheses). Bars are grouped by task category, with the number of tasks per category shown below each group (n). A more detailed, task-level breakdown of success rates is provided in Figure ˜ 7 .

This figure (Figure 6) from the paper "TUA-Bench: A Benchmark for General-Purpose Terminal-Use Agents" clearly illustrates the success rates of eight different large language models (LLMs) on the TUA-Bench benchmark, categorized by five different task types.

First, let's understand the various components of the graph:

  1. Y-axis (Vertical Axis): Represents the "Success Rate," ranging from 0% to 90%. This measures the proportion of tasks successfully completed by a model within a specific task category.
  2. X-axis (Horizontal Axis): Represents five different "task categories," which are:
    • Office (n=46): Office-related tasks, containing 46 tasks.
    • Web & Info (n=22): Web and information retrieval tasks, containing 22 tasks.
    • System & SW (n=19): System and software tasks, containing 19 tasks.
    • Sci. & Eng. (n=17): Science and engineering tasks, containing 17 tasks.
    • Multimedia (n=16): Multimedia tasks, containing 16 tasks. The "n" value below each task category indicates the number of tasks included in that category.
  3. Legend: Located at the top of the graph, it lists the eight different models along with their corresponding "reasoning-effort" settings. These models include:
    • GPT-5.5 (xhigh)
    • Gemini 3.1 Pro (high)
    • MiniMax-M3 (xhigh)
    • Qwen3.7-Max (xhigh)
    • Claude Opus 4.8 (max)
    • GLM-5.1 (xhigh)
    • DeepSeek-V4-Pro (xhigh)
    • Kimi-K2.6 (xhigh) Each model is represented by a different colored bar.
  4. Bar Chart: The bar chart is grouped by task categories. Within each task category group, there are eight bars, each corresponding to one of the eight models from the legend. The height of each bar represents the success rate of that model in that particular task category.
  5. Data Flow and Comparison:
    • The reader first focuses on a task category on the X-axis, for example, "Office."
    • Then, they observe the heights of all eight bars within that category to compare the performance of different models on the same task category. For instance, in the "Office" category, Claude Opus 4.8 (max) appears to have a higher success rate than some other models.
    • Next, one can compare the performance of the same model across different task categories horizontally. For example, observe how GPT-5.5 (xhigh) performs in "Office," "Web & Info," and other categories.
  6. Methodology Revealed:
    • This graph displays the results from the TUA-Bench benchmark. TUA-Bench is designed to evaluate the capabilities of general-purpose terminal agents (TUAs).
    • The testing methodology involves: using an agent named Terminus-2, running these eight models, each set to a specific "reasoning-effort" level (such as xhigh, high, max).
    • Each task is manually designed, runs in a real terminal environment with a deterministic setup script, and is evaluated by an execution-based scoring protocol.
    • The data in the graph represents the success rate for each task category, rather than detailed results for individual tasks (a more detailed task-level breakdown is provided in Figure 7).
  7. Conclusions and Observations:
    • This graph reveals the relative strengths and weaknesses of different models across different types of terminal tasks.
    • For example, in the "Web & Info" category, Claude Opus 4.8 (max) has the highest success rate, approaching 90%.
    • In the "System & SW" category, several models (like GPT-5.5 (xhigh), GLM-5.1 (xhigh), DeepSeek-V4-Pro (xhigh)) have relatively high success rates, around 60-70%.
    • Overall, there are significant differences in performance across different models and different task categories, indicating that certain models might be better suited for specific types of terminal tasks.
    • The figure also shows the number of tasks in each category (n), which helps understand the statistical significance of the success rates (e.g., categories with more tasks might provide a more stable estimate of success rate).

In summary, this figure, through a bar chart format, intuitively compares the success rates of eight large language models across five different task categories in the TUA-Bench benchmark. It shows the performance of each model in different types of terminal tasks, thus helping us understand the current capabilities and limitations of terminal agents in various scenarios. For instance, Claude Opus 4.8 (max) performs excellently across multiple categories, especially in "Web & Info." Other models might be more competitive in specific categories. This graph is an important visualization tool for assessing and comparing the performance of general-purpose terminal agents.

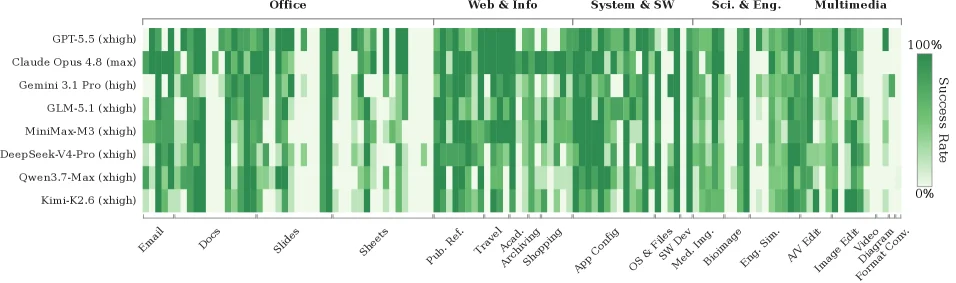
Figure 7 : Task-level success rate heatmap. Mean success rate runs for eight models evaluated with the Terminus-2 agent on each TUA-Bench task. Rows correspond to model configurations and columns correspond to individual tasks, grouped by category and subcategory. Darker cells indicate higher success rate. The heatmap reveals substantial within-category heterogeneity: each category contains both broadly solved tasks and tasks that remain difficult for nearly all models, highlighting task-level capability gaps that are obscured by category-level averages.

This figure is a task-level success rate heatmap, illustrating the performance of different models on various tasks within the TUA-Bench benchmark. Let's break down the components and their meanings in detail:

First, the rows of the heatmap represent different model configurations. From top to bottom, these are: * GPT-5.5 (xhigh) * Claude Opus 4.8 (max) * Gemini 3.1 Pro (high) * GLM-5.1 (xhigh) * MiniMax-M3 (xhigh) * DeepSeek-V4-Pro (xhigh) * Qwen3.7-Max (xhigh) * Kimi-K2.6 (xhigh) These rows show the eight different models (or their specific configurations) that were evaluated. The "flow" of data or information can be understood as: for each model (each row), we observe its performance across all tasks (each column).

Second, the columns of the heatmap represent individual tasks from the TUA-Bench benchmark. These tasks are grouped under different categories and subcategories, whose labels are located at the top of the chart. From left to right, the main categories include: * Office: This broad category is further divided into subtasks such as: * Email * Docs * Slides * Sheets * Web & Info: Subtasks under this category include: * Pub. Ref. (Publication Reference) * Travel * Acad. Searching (Academic Search) * Shopping * System & SW (System & Software): Subtasks here include: * App Config (Application Configuration) * OS & Files (Operating System & Files) * Sys. Mgmt. (System Management) * Bioinformatics * Sci. & Eng. (Science & Engineering): Subtasks include: * Eng. Sim. (Engineering Simulation) * AV Edit (Audio/Video Editing) * Multimedia: Subtasks include: * Image Edit * Video Edit * Document Format Convert. (Document Format Conversion)

Each cell (the intersection of a row and a column) represents the mean success rate of the corresponding model on the corresponding task. The color bar on the right side of the chart indicates the mapping between color and success rate: * Dark green indicates a high success rate (close to 100%). * Light green or near-white colors indicate a low success rate (close to 0%).

This figure reveals how the method operates: 1. Task Selection: Researchers selected 120 real-world tasks from the TUA-Bench benchmark, organized into five main categories and multiple subcategories. These tasks cover routine digital activities (like document editing, email management, web information search) and scientific/engineering workflows requiring specialized software. 2. Model Evaluation: They used an agent named "Terminus-2" to run eight different models (as shown in the figure) in a real terminal environment. The execution environment for each task was initialized using a deterministic setup script to ensure consistency and reproducibility. 3. Performance Assessment: For each model's execution on each task, an execution-based scoring protocol was used to determine if the task was successfully completed. These binary success/failure results were then aggregated into an average success rate. 4. Visualization: Finally, these average success rates are presented as a heatmap. The order of rows corresponds to different models, and the order of columns corresponds to tasks organized by category and subcategory.

From analyzing this heatmap, we can draw the following conclusions: * Within-category heterogeneity: The heatmap reveals significant "within-category heterogeneity." This means that within each major task category (e.g., "Office," "Web & Info"), there are both tasks that are broadly solved by most models (represented by dark green cells) and tasks that remain challenging for nearly all models (represented by light green or white cells). * Obscured capability gaps: This within-category heterogeneity indicates that looking only at category-level average success rates might obscure capability gaps at the specific task level. A category might appear to perform well overall, but it may contain some tasks that are difficult for models. * Differences in model performance: Different models show varying performance across different tasks. While some models might excel in specific categories or tasks, they might perform poorly in others. Similarly, no single model achieves the highest success rate on all tasks.

In summary, this figure visualizes the success rates of different models across various tasks in the TUA-Bench benchmark, clearly showing the distribution and differences in model capabilities when handling different types of terminal tasks. It emphasizes the importance of task-level evaluation to avoid being misled by category-level average performance.

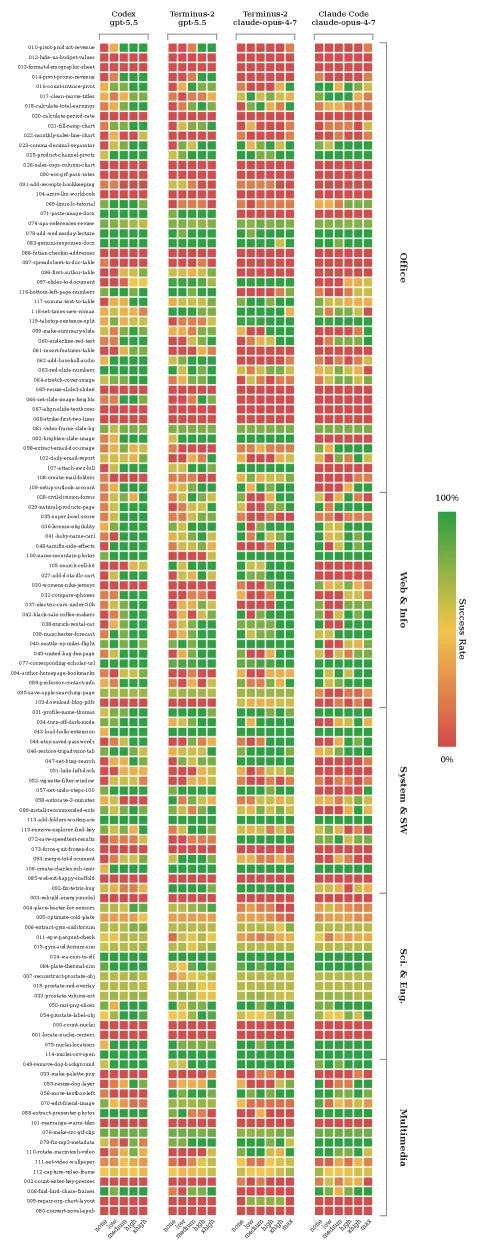
Figure 9 : Effect of reasoning effort on task-level performance in TUA-Bench. Rows are individual tasks (identifier and name on the left), grouped by the five task categories (right labels). Columns are organized into four agent–model blocks; within each block, columns correspond to increasing reasoning-effort settings (bottom labels: none , low , medium , high , xhigh , and additionally max for Claude Opus 4.7). Best viewed in color and zoomed in.

This figure (Figure 9) is from the paper "TUA-Bench: A Benchmark for General-Purpose Terminal-Use Agents" and illustrates the task-level performance of various terminal-use agents on the TUA-Bench benchmark under different levels of reasoning effort.

First, let's understand the structure of the figure:

  1. Rows: Each row in the figure represents an individual task. On the far left of each row, you can see the task identifier (e.g., "011-generate-pdf-report") and the task name (though the name might be difficult to read completely due to resolution). These tasks are grouped into five main task categories, which are labeled on the far right of the figure, from top to bottom:

    • Office
    • Web & Info
    • System & SIT
    • Sci & Eng
    • Multimedia This grouping helps in observing performance differences across different types of tasks.
  2. Columns: Each column in the figure represents a specific "agent-model-reasoning effort" combination. Specifically:

    • There are four main column blocks in the figure, corresponding to four different agent-model combinations:
      • First column block: CodeLlama-5.5p
      • Second column block: Terminal-2 gpt-5.5
      • Third column block: Terminal-2 claude-opus-4.7
      • Fourth column block: Claude Code claude-opus-4.7
    • Within each such column block, the columns from left to right represent increasing levels of reasoning effort. According to the legend (bottom label), these reasoning effort levels include: none, low, medium, high, xhigh, and for the "Claude Code claude-opus-4.7" combination, there is an additional "max" reasoning effort level.
  3. Color Coding: The color of each cell represents the success rate for that specific task, under the specific agent-model-reasoning effort setting. The color bar is on the right side of the figure, showing the correspondence between colors and success rates:

    • Green represents a high success rate (close to 100%).
    • Yellow represents a medium success rate.
    • Red represents a low success rate (close to 0%). This color coding allows for an intuitive comparison of performance across different tasks, different agents, and different levels of reasoning effort.
  4. Flow of Data or Information: The reader would first select a task (via the rows), and then can compare the performance of different agents (via the column blocks) at the same level of reasoning effort, or compare the same agent at different levels of reasoning effort (via different columns within the same column block). The goal is to understand which agents perform best on which tasks, and whether increasing reasoning effort generally improves success rates.

The methodology (or experimental design) revealed by this figure is as follows:

  • Task Design: TUA-Bench includes 120 real-world tasks that were manually designed and cover five main task categories, aiming to evaluate the general capabilities of terminal-use agents, not just programming or technical workflows.
  • Execution Environment: Each task is run in a real terminal environment with a deterministic setup script, meaning the experimental conditions are reproducible.
  • Evaluation Protocol: Task completion is evaluated using an execution-based scoring protocol, i.e., whether the agent can successfully complete the task (e.g., achieve the expected output or state).
  • Impact of Reasoning Effort: This figure specifically focuses on the impact of reasoning effort on task performance. By running the same agent-model combination at different reasoning effort settings, researchers can quantify the performance improvement brought by increased reasoning effort.
  • Comparative Analysis: By placing different agent-model combinations side by side, it allows for a visual comparison of their relative performance on the same tasks and at the same reasoning effort levels.

Conclusions (based on the figure and its caption):

  • Performance Differences: The figure clearly shows significant differences in performance across different agents and different tasks. Some tasks are easy for all agents (most cells are green), while some tasks are difficult for all agents (most cells are red).
  • Effect of Reasoning Effort: Generally, as the level of reasoning effort increases (from left to right within the same column block), the task success rate also improves. This can be observed from the change in color (from red or yellow to green). For example, for certain tasks, the success rate at the "max" reasoning effort level is significantly higher than at lower levels.
  • Best Performance: According to the caption, the strongest frontier agent, "Claude Code with Claude Opus 4.8 max reasoning effort," achieved an overall performance of 65.8%. This means there is still a large gap before terminal-use agents can reach human-level performance, even under optimal conditions.
  • Differences Between Task Categories: Although not explicitly stated in the figure, it can be observed that different task categories (e.g., Office vs. Sci & Eng) may differ in overall difficulty or in the performance of different agents. For example, some agents might perform better on "Web & Info" tasks, while others might perform better on "System & SIT" tasks.
  • Comparison Between Agents: Different agent-model combinations show clear differences in performance. For example, "Claude Code claude-opus-4.7" (especially with "max" reasoning effort) seems to perform better on many tasks than other agents (such as CodeLlama-5.5p or Terminal-2 gpt-5.5).

In summary, this figure, in the form of a color-coded matrix, intuitively displays the success rates of different terminal-use agents in completing various tasks on the TUA-Bench benchmark under different levels of reasoning effort. It reveals the positive impact of reasoning effort on performance, the performance differences between different agents, and the challenges across different types of tasks. This is significant for understanding the current capabilities and limitations of terminal-use agents and for guiding future research directions.

← → flip · ↑ ↓ scroll notes · Esc exit